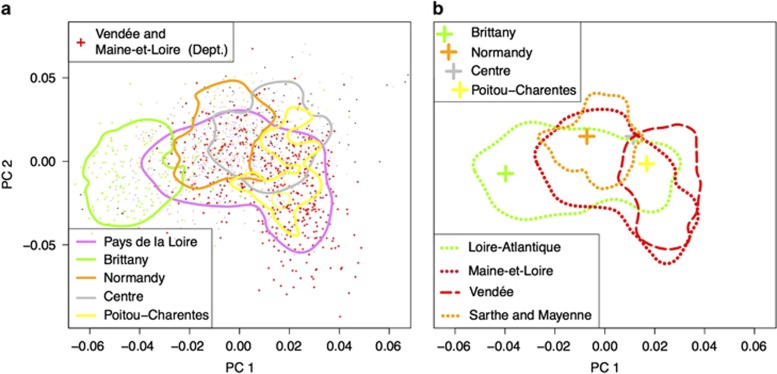
Figure 2.
PCA of the CavsGen-DESIR data set. The envelopes correspond to the areas that contain 75% of the individuals of a given subdivision. (a) The envelopes correspond to the different regions of WF. Individuals from Brittany and from the Vendée and Maine-et-Loire Departments are displayed with larger crosses than the other individuals. (b) The envelopes correspond to the different departments of the Pays de la Loire Region, the Region with the majority of sampled individuals. Large crosses correspond to the barycentric coordinates of the individuals grouped by regions.

