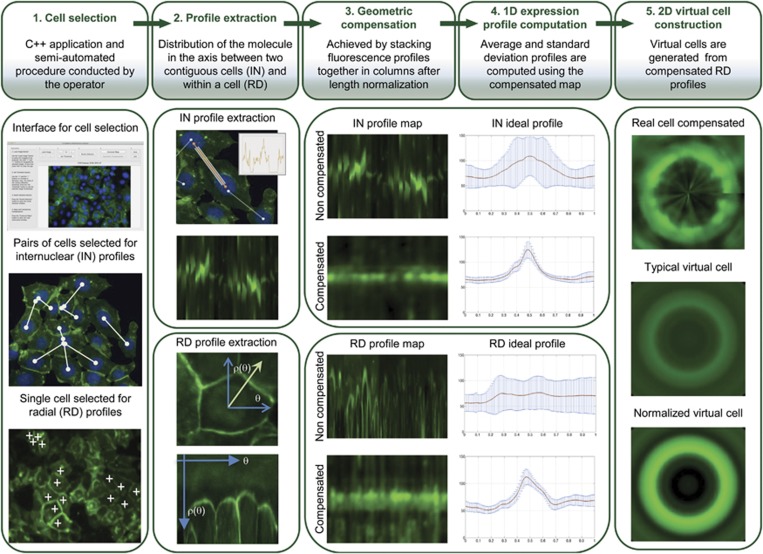
Figure 1.
Scheme representing the analytical pipeline. The analytical pipeline includes the following steps: (1) cell selection using a C++ application; (2) IN and RD profiles extraction; (3) geometrical compensation of IN and RD profiles to cope with cell shape and size variability; (4) original and compensated IN and RD profiles with corresponding standard deviation bar for each point; and (5) 2D virtual cell construction based on RD compensated profiles.

