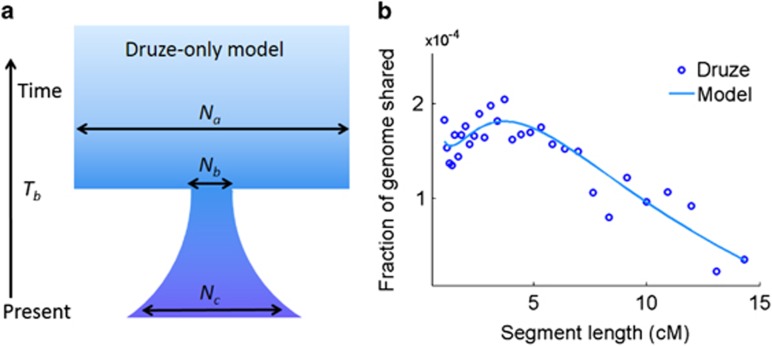
Figure 2.
A demographic model for the recent Druze history. (a) A suggested bottleneck and expansion model. The inferred values of the parameters are given in Table 2 under ‘Druze-only model'. The horizontal arrows correspond to effective population sizes. (b) After trio phasing the Galilee and Golan genotypes, we detected IBD segments of length >0.5 cM and plotted the fraction of the genome shared vs the segment length (after logarithmic binning; circles are at mid-bins). We then identified the demographic model that best fits the observed curve (line).

