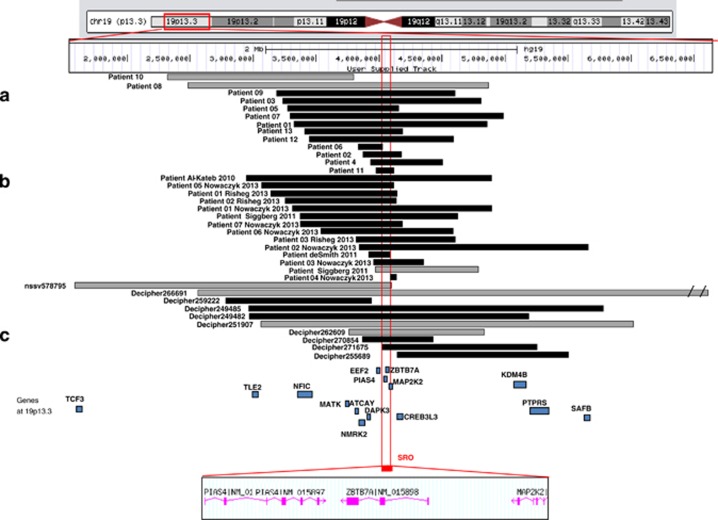
Figure 2.
Graphical representation of interstitial 19p13.3 deletions and duplications; genes within the minimal region of overlap. SRO (chr19: 3979568–4093035; hg19; NCBI build 37). Patients are from our series (a); previous reports (b) and public databases, such as DECIPHER and ISCA consortium (c). Gray; duplications, Black; deletions.

