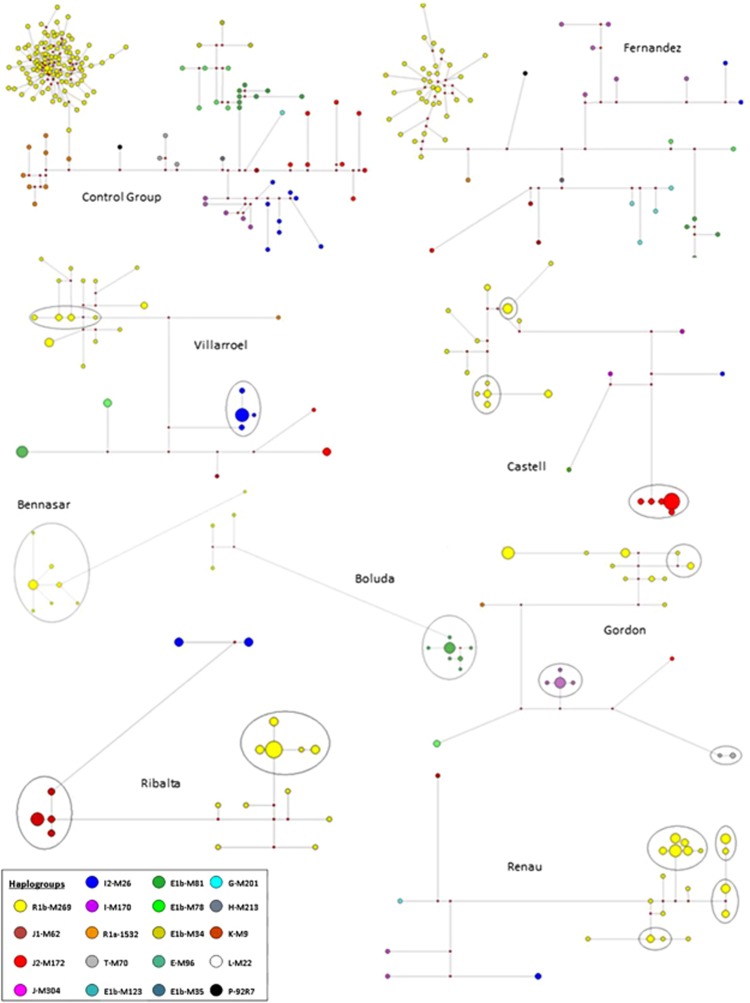
Figure 3.
Selected median-joining networks. A selection of median-joining networks representing Y haplogroup and Y STR diversity within surnames plus the control sample set. Each circle represents a distinct haplotype, with circle area proportional to frequency and with the smallest circle in each network representing n=1. The line length between haplotypes indicates their mutational divergence (SNP and STR mutational steps). The small red dots are median vectors (hypothesised and often ancestral sequences required to connect existing sequences within the network). Borders of descent clusters are displayed by the solid-line ellipses.

