
Figure 2.
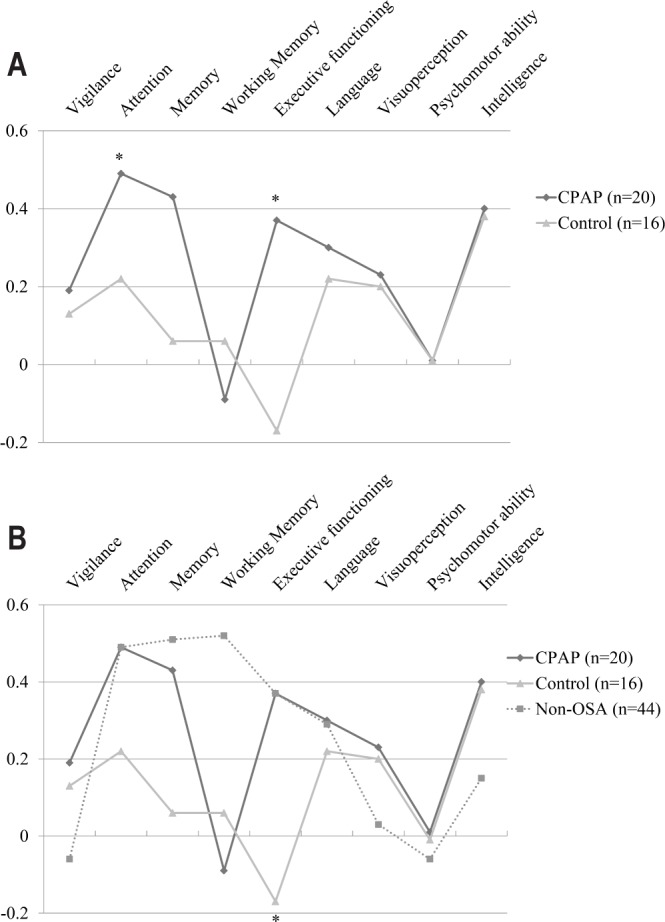
(A) Profile of mean z-scores of difference between T1 and T0 for the nine cognitive domains in CPAP group and control group. *Significant difference between the CPAP and control group. (B) Profile of mean z-scores of difference between T1 and T0 for the nine cognitive domains for the non-OSA group compared to the CPAP group and OSA control group. *Significant difference between the OSA control group and both the non-OSA group and CPAP group.