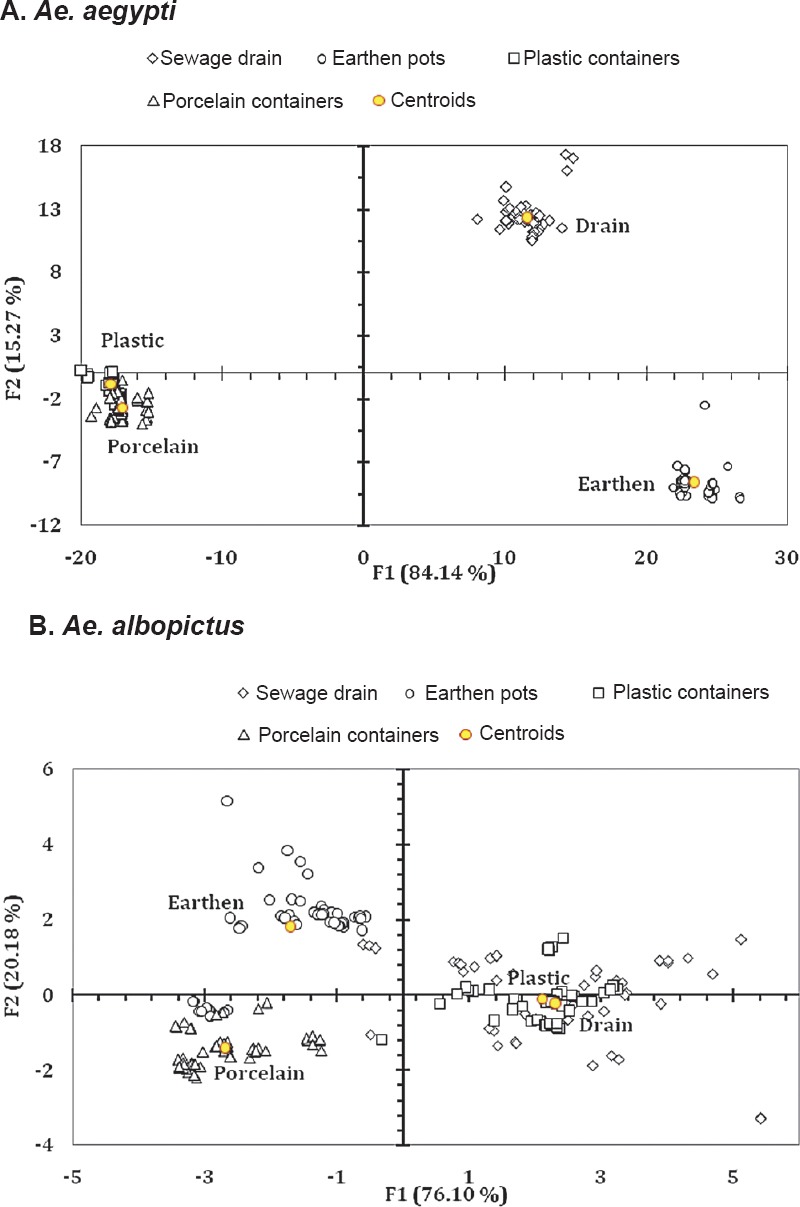
Fig. 3.

Biplot representation of the ordination of the abundance of (A) Ae. aegypti and (B) Ae. albopictus in the different habitats surveyed as explained by the life history traits and energy reserves. For Ae. aegypti Wilks’ λ = 0.00002; F30, 667 = 948.054; P<0.001. For Ae. albopictus Wilks’ λ = 0.056; F30, 667 = 37.163; P<0.001.
