Figure 1.
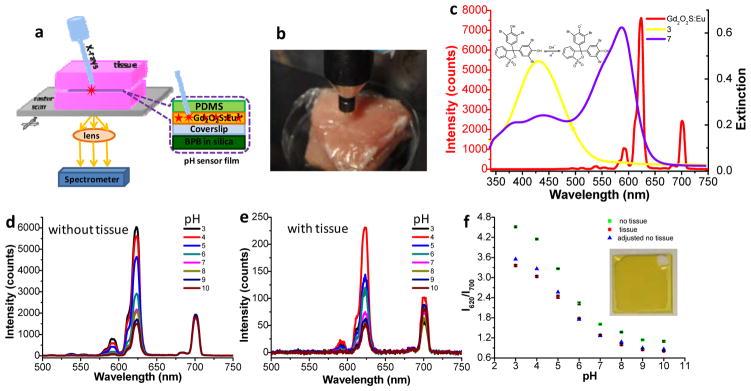
XELCI setup and pH calibration curves with and without tissue. (a) Schematic drawing of the XELCI setup. (b) Photograph of the setup. (c) Luminescent spectrum of scintillators (Gd2O2S: Eu) (red line, left y-axis) and the extinction spectra of BPB-doped silica films in pH buffer 3.0 (yellow, right y-axis) and buffer 7.0 (purple, right y-axis). Inset: acidic and basic forms of BPB. (d) Luminescence spectra of pH sensor film in response to different standard buffers range from pH 3.0 to pH 10.0. (e) Luminescence spectra of pH sensor film in response to different pH buffers after passing through porcine tissue. (f) pH calibration curves without tissue (green squares), with tissue (red dots) and the adjusted no tissue calibration curve adjusted using the reference region (blue triangles). Error bars represent standard deviation of three different measurements at different positions on the same sample. Inset: photograph of a pH sensor film with uncoated reference region (white region) on top right.

