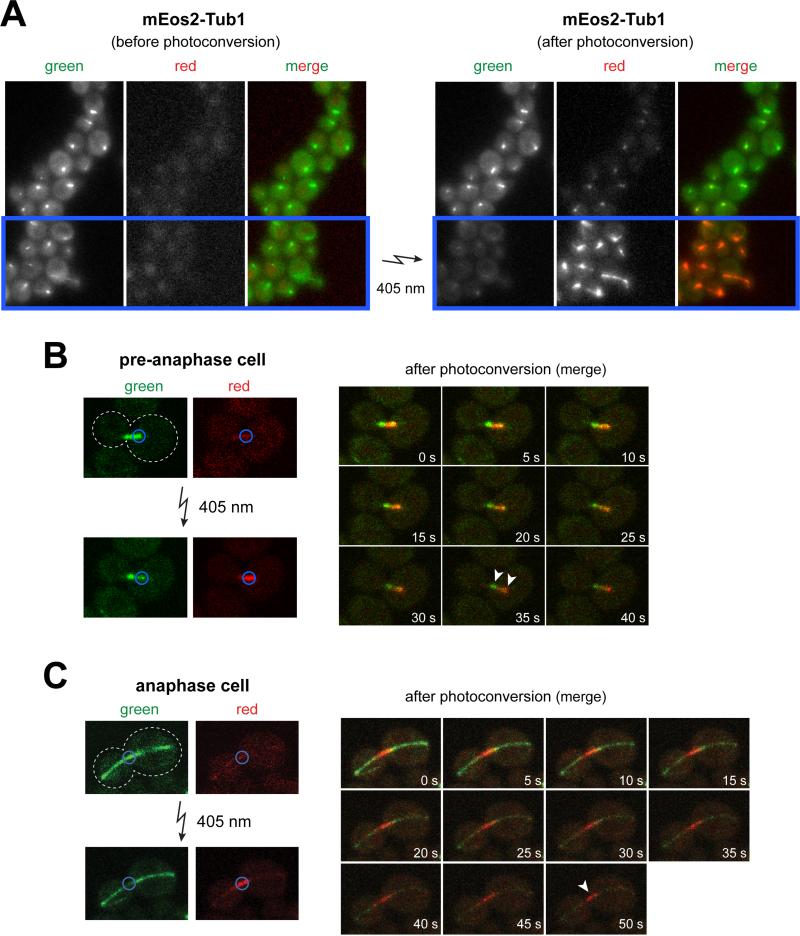
Figure 4. Photoconversion of mEos2-Tub1 using wide-field and confocal fluorescence microscopy.
(A) Representative image depicting mEos2-Tub1-expressing cells before (left) and after (right) photoconversion. Blue box indicates area in the field targeted for exposure to 5 second pulse of 405 nm light (by reducing field diaphragm). Note the reduction in green fluorescence concomitant with the appearance of red fluorescence following photoconversion. (B) Example of a mEos2-Tub1-expressing pre-anaphase cell subjected to local photoconversion by laser scanning confocal fluorescence microscopy. Half of the pre-anaphase spindle (marked by blue circle) was exposed to a brief 405 nm laser pulse. Pre- (green) and post- (red) photoconverted mEos2-Tub1 fluorescence were subsequently imaged every 5 s for 40 s. Clear separation of green and red fluorescence at t = 35 s (arrowheads) indicates low turnover of tubulin within the spindle in this timeframe. (C) Similar to (B) but the spindle midzone of an anaphase cell was photoconverted. Green and red fluorescence were subsequently imaged every 5 s for 50 s. White arrowhead indicates persistence of photoconverted mark at t = 50 s suggesting low turnover of interpolar spindle microtubules within the indicated timeframe.

