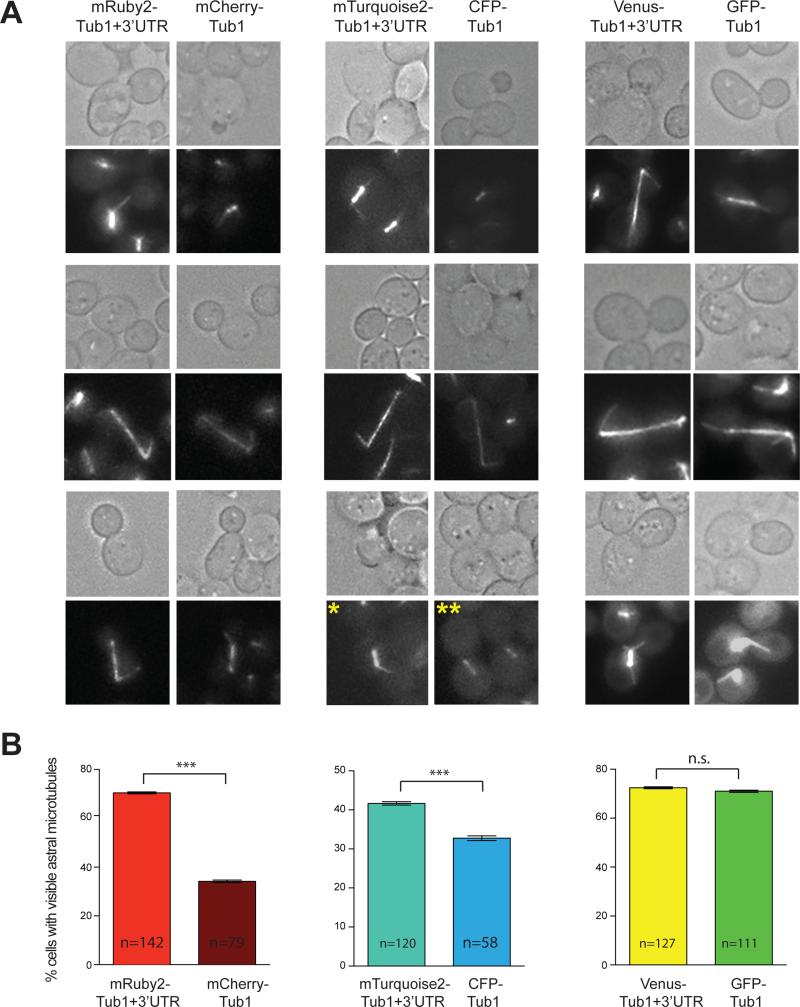
Figure 6. Side-by-side comparison of astral microtubules visualized by TUB1+3'UTR-FP with older FP-TUB1 constructs.
(A) Representative fluorescence images of astral microtubules of each FP-Tub1 fusions. Each image is a maximum intensity projection of a 1 μm Z-stack with 0.5 μm step size, with 2X averaging of 80 ms exposure for each frame. Note that the exposure to capture clear astral microtubules was higher than that needed for mitotic spindle as in Figure 3 and 5. Asterisk (*) indicates an example of a cell with visible astral microtubule (for scoring in (B)), whereas double-asterisk (**) indicates an example of cells with no visible astral microtubules. (B) Frequency of observing astral microtubules for each indicated FP-Tub1. Error bar represents standard error of proportion. ***, p < 0.0001, and n.s., not significant, by Student's t-test.

