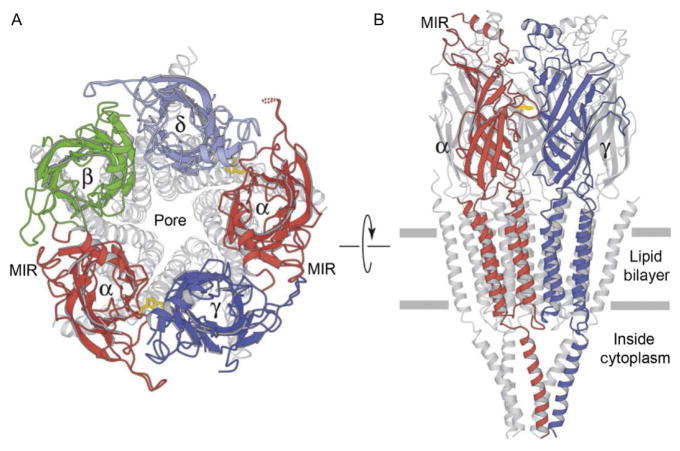
Figure 3.
Illustrations of ribbon diagrams of the nAChR. (A) View from the top into the pore with only the upper most portion highlighted in colors (gray shades in the print version). (B) View from the side with only the front two subunits highlighted in colors (gray shades in the print version). The plane of the membrane is indicated by the two horizontal gray lines. Adapted from Fig. 3 of Unwin (2005).

