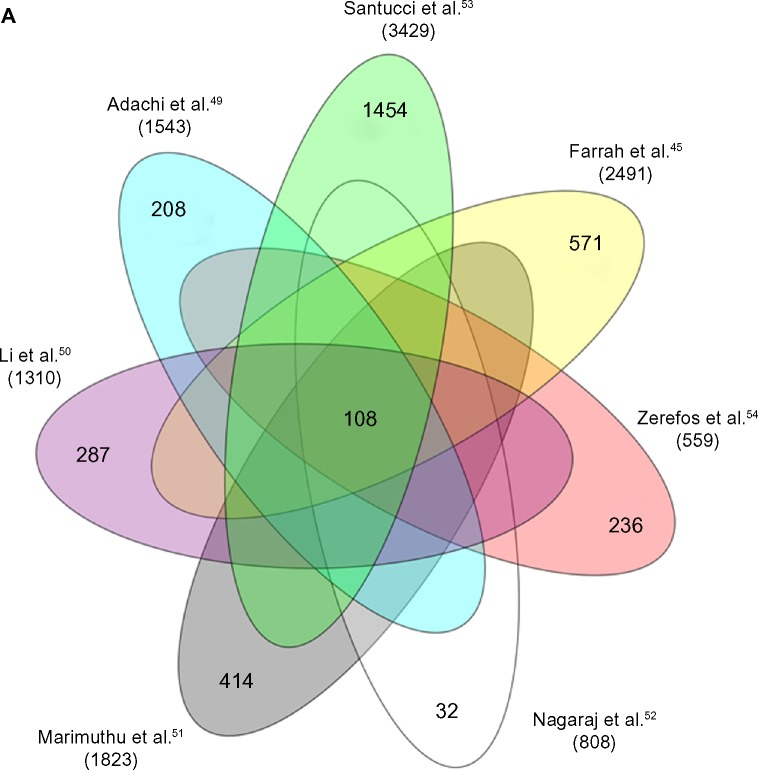
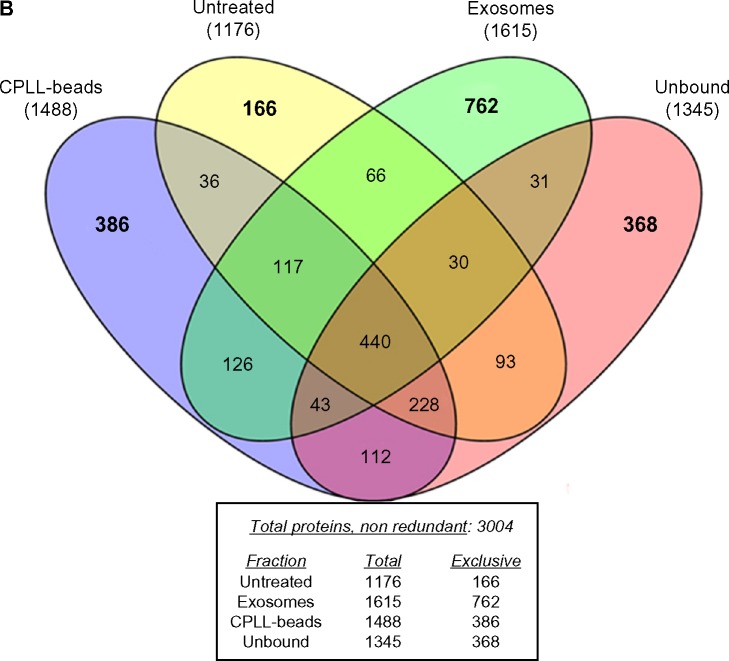
Figure 2.
(A) Venn diagram reporting the seven studies that constitute the main part of knowledge on urine proteome. This diagram shows the number of total and unique nonredundant proteins reported in different studies.45,49–54 In the middle of the diagram is reported the number of proteins shared by all the studies. With respect to our data,53 we report only proteins with a peptide ID of 1% false discovery rate, at a peptide mass deviation of 10 ppm and a minimum of six amino acids per identified peptide. (B) Venn diagram showing how many proteins are separated by the multistep procedure described in this report that represents a simplification of what was already described by Santucci et al.53 Utilizing this approach, 3004 nonredundant proteins can be detected in normal urine most of which are present in more than one purification fraction; a considerable part of proteins can be detected in exosomes (762), followed in order of importance by CPLL beads (386) and the unbound to CPLL (368).


