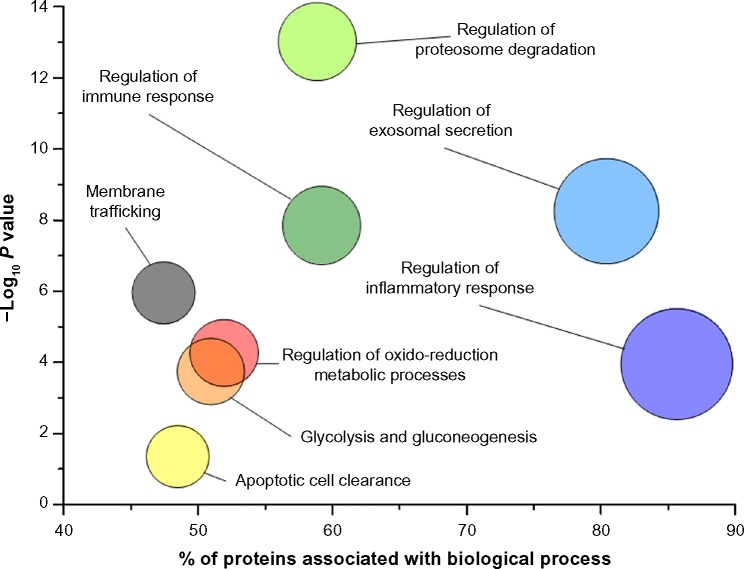
Figure 3.
GO analysis of proteins purified from urine according to the scheme of Figure 1. The graph shows the main biological processes (circles) plotted against the − Log10 P where P-value indicates the probability, after false discovery rate correction, that components of a biological process are present in urine; it is calculated on the basis of the number of proteins identified and their interaction considering the data of the literature.

