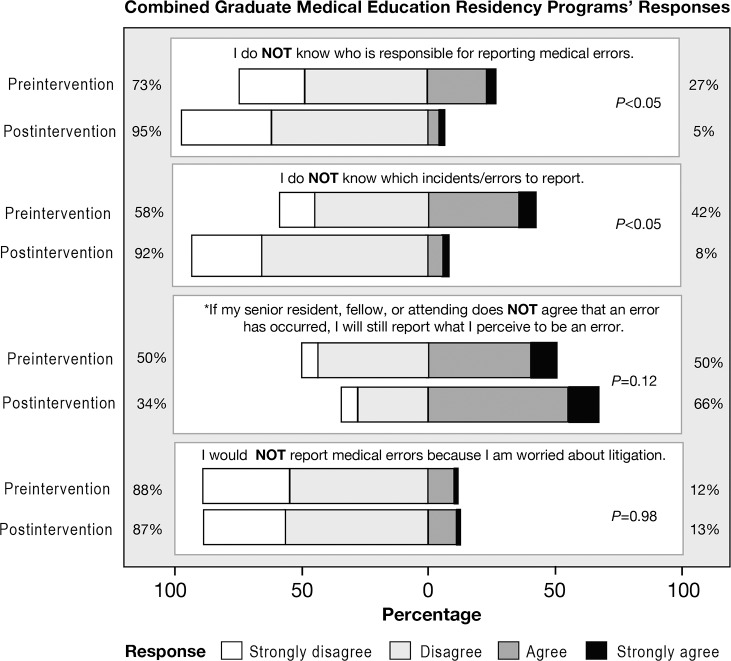
Figure 3.
Difference between the preintervention and postintervention responses to 4 questions on the Healthcare Providers' Perceptions of Safety Events Questionnaire. The distribution of responses is presented as percentages. The agree and strongly agree responses are aggregated on the right, and the disagree and strongly disagree responses are aggregated on the left. For example, results from preintervention indicate that 42% of respondents did not know which incidents/errors to report. However, following the intervention, this percentage significantly decreased to 8% (P<0.05). *The response to this question was statistically significant for obstetrics/gynecology only (P<0.05).

