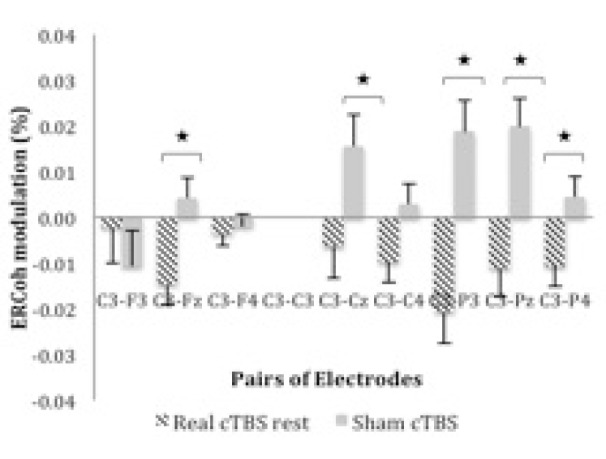
Figure 1.

ERCoh low β as a function of Group and pairs of electrodes. The figure illustrates EEG synchronisation of C3-Fz, C3-Cz, C3-P3, C3-Pz, and C3-P4 pairs of electrodes for real cTBS compared to sham at rest.
*significant real cTBS rest vs sham (P < 0.05; Bonferroni corrected; n = 26).
