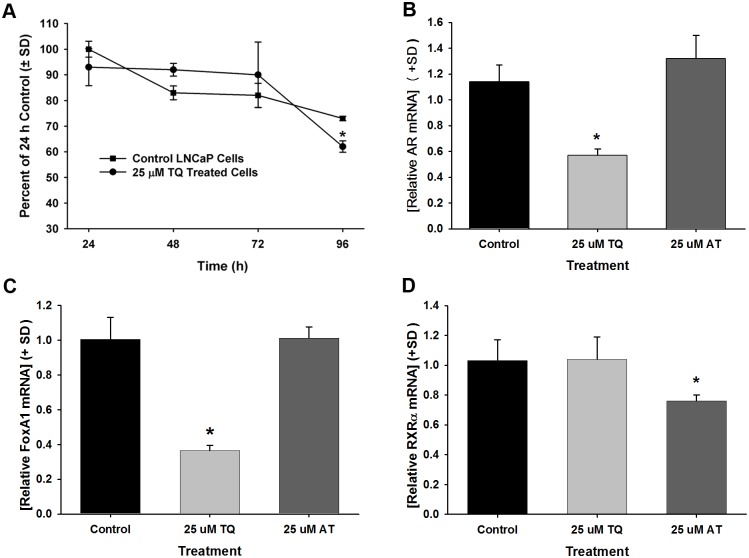
Fig 5.
A-D. Expression of transcription factor mRNAs in TQ-treated LNCaP and LAPC4 cells. (A) Time course analysis of AR mRNA levels in TQ treated LNCaP cells compared to AR mRNA levels in control, vehicle treated LNCaP cells. (B) mRNA levels in LAPC4 cells treated for 4 d with 25 μM TQ or 25 μM AT compared to control, vehicle-treated cells. Levels of FOXA1 mRNA (C) and RXRα mRNA (D) in LNCaP cells treated for 4 d with 25 μM TQ or 25 μM AT compared to controls. * P<0.05.

