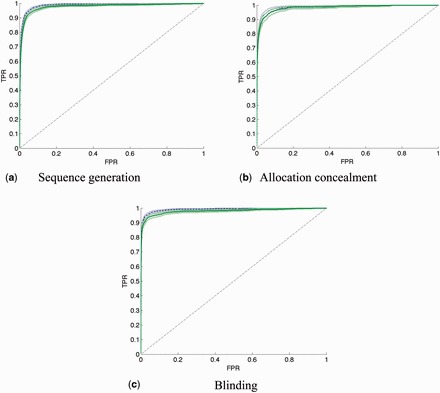
Figure 5.

ROC curves for sentence-level learning comparing results using the relevant/not dataset, compared with the train relevant/rest, test relevant/not results, for each risk-of-bias property. Test B: blue dashed curve. Test C: green solid curve. Generated with parametric rate-oriented method 33 with associated point-wise confidence bounds. This method requires a constant number of examples of each label (low,not-low) in each fold, so we add examples to make N constant, and use random selection of examples to correct these frequencies, for instance by removing a randomly selected positive example and duplicating a randomly selected negative example in a particular fold. TPR: true positive rate; FPR: false positive rate.
