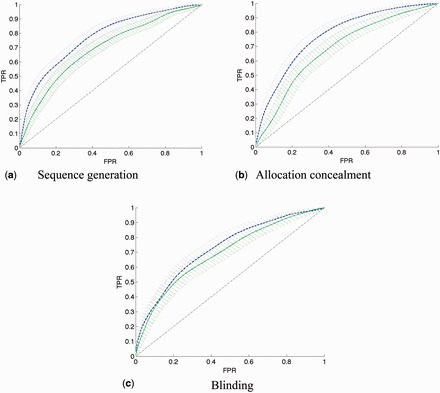
Figure 6.

ROC curves for predicting article risk of bias. Generated with parametric rate-oriented method 33 with associated point-wise bounds. Blue dashed line: article contents (model 1); green solid line: PubMed title and abstract (model 3); TPR: true positive rate; FPR; false positive rate.
