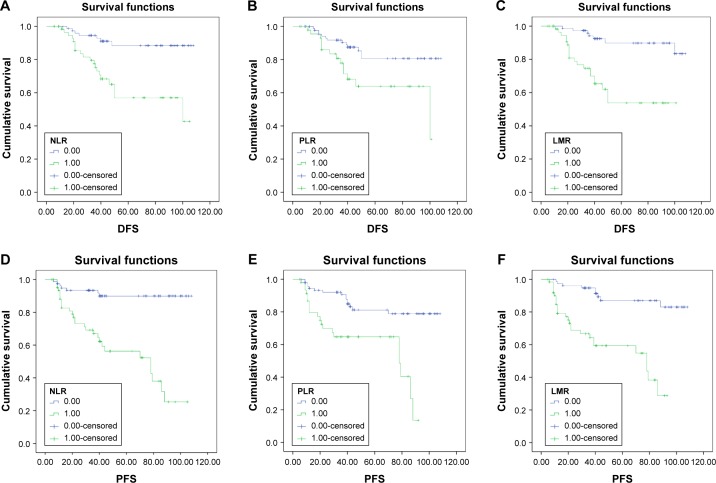
Figure 2.
Kaplan–Meier curves for DFS and PFS of patients with UUTUC.
Notes: (A) DFS curves of patients with UUTUC in the low-NLR group (<2.2) vs the high-NLR group (≥2.2), P<0.001; (B) DFS curves of patients with UUTUC in the low-PLR group (<128) vs the high-PLR group (≥128), P=0.01; (C) DFS curves of patients with UUTUC in the high-LMR group (≥3.6) vs the low-LMR group (<3.6), P<0.001. (D) PFS curves of patients with UUTUC in the low-NLR group (<2.2) vs the high-NLR group (≥2.2), P<0.001; (E) PFS curves of patients with UUTUC in the low-PLR group (<128) vs the high-PLR group (≥128), P<0.001; (F) PFS curves of patients with UUTUC in the high-LMR group (≥3.6) vs the low-LMR group (,3.6), P<0.001.
Abbreviations: DFS, disease-free survival; LMR, lymphocyte–monocyte ratio; NLR, neutrophil–lymphocyte ratio; PFS, progression-free survival; PLR, platelet–lymphocyte ratio; UUTUC, upper urinary tract urothelial carcinoma.

