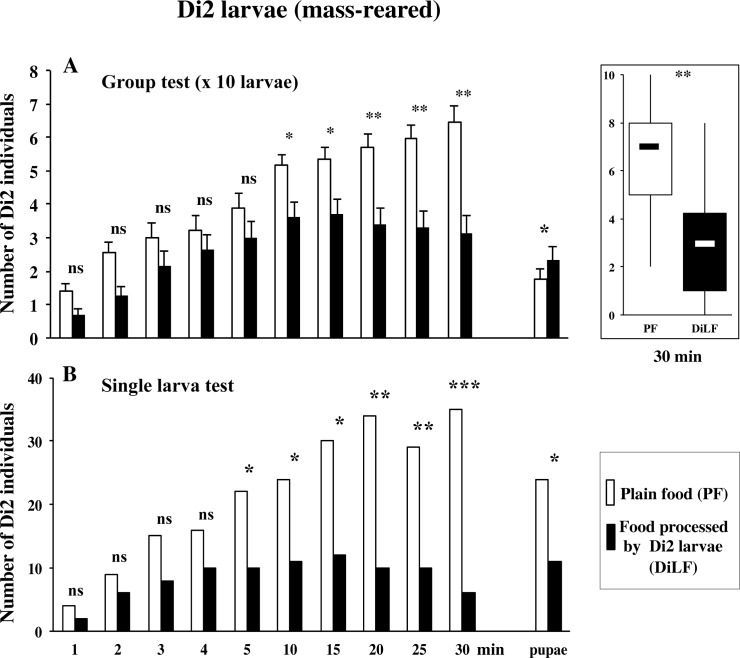
Fig 3. Food preference of Dijon2000 larvae tested either in groups or individually.
Mass-reared early 3rd instar Dijon2000 larvae (Di2) were tested either by groups of 10 (A) or individually (B) in a dual-choice test consisting of a petri dish containing two patches: one impregnated with plain food (PF; empty bars), and the other with food processed by Di2 larvae (DiLF; filled bars). The measurements were carried as in Fig 2. Histograms show the mean (± sem) distribution or the box and whisker plots representation at 30 min (A), and the number of larvae and pupae (B) on each patch. These distributions were tested at each time point using a Wilcoxon test (A) or a binomial Poisson distribution (B). The statistical significance is indicated as follows: ***: p<0.001; **: p<0.01; *: p<0.05; ns: p>0.05. N = 20 groups (A), or 100 larvae (B).

