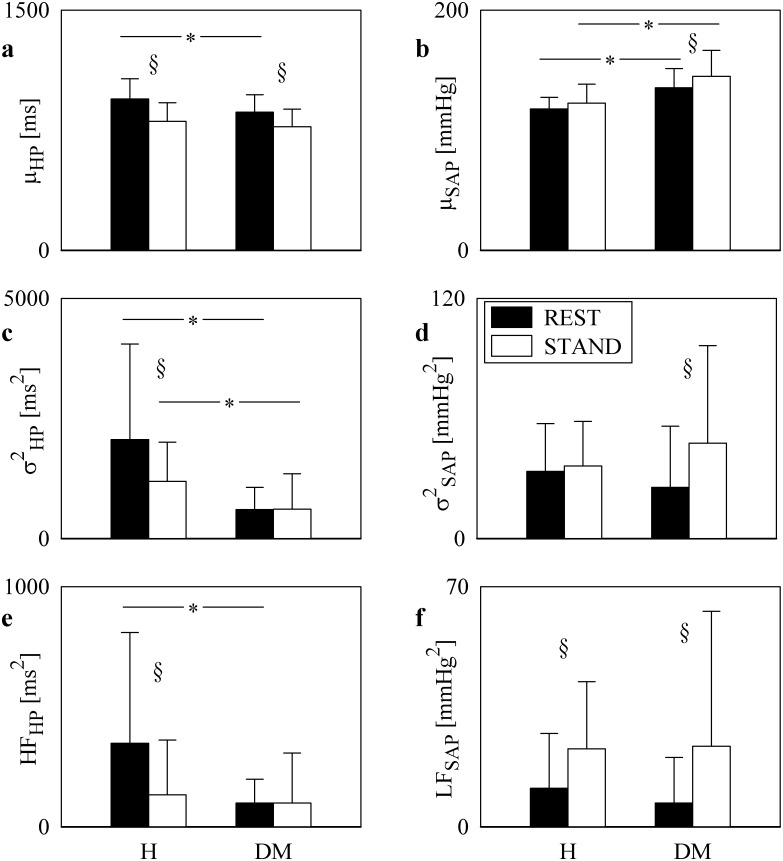
Fig 1. Univariate time and frequency domain analyses of HP and SAP series.
The grouped bargraphs show the results of time and frequency domain analyses of HP and SAP series as a function of the group (i.e. H and DM individuals) at REST (black bars) and during STAND (white bars). The graphs are relevant to μHP (a), μSAP (b), σ2HP (c), σ2SAP (d), HFHP (e), and LFSAP (f). Values are given as mean plus standard deviation. The symbol * indicates differences between groups (i.e. H vs DM) with p<0.05, while the symbol § indicates differences between experimental conditions (i.e. REST vs STAND) with p<0.05.

