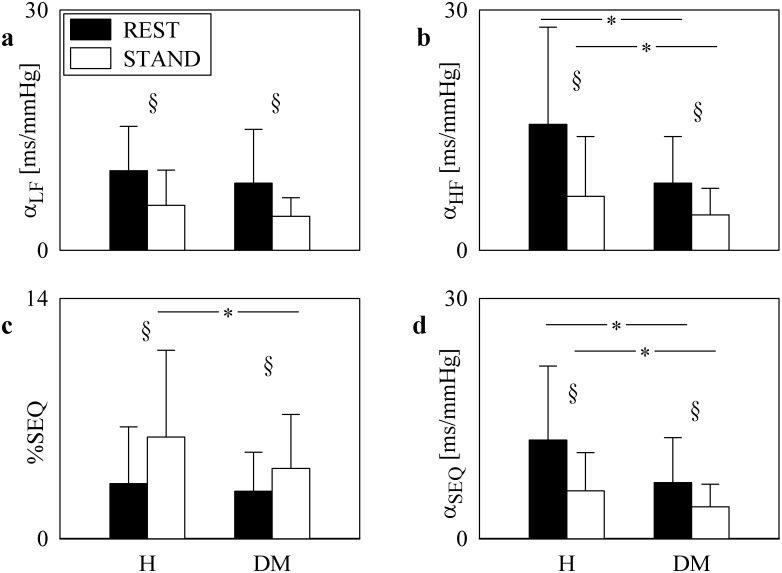
Fig 3. Time and frequency domain BRS parameters.
The grouped bargraphs show the BRS estimates as a function of the group (i.e. H and DM individuals) at REST (black bars) and during STAND (white bars). The graphs are relevant to αLF (a), αHF (b), %SEQ (c), and αSEQ (d). Values are given as mean plus standard deviation. The symbol * indicates differences between groups (i.e. H vs DM) with p<0.05, while the symbol § indicates differences between experimental conditions (i.e. REST vs STAND) with p<0.05.

