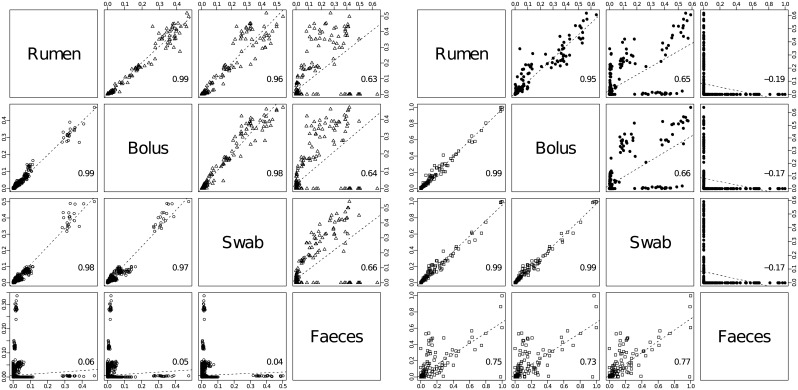
Fig 4. Scatter plot analysis of differences in relative abundance, estimated for each microbial taxon in all individual animals and across sample types, respectively.
a) Each bacterial taxon in samples collected from all cows is represented as separate (○) in the lower triangle, while archaea are presented as (Δ) in the upper triangle; b) Anaerobic fungi are marked as (□) and ciliate protozoa as (●). The average Pearson correlation coefficient is indicated in the bottom-right corner of each diagram.

