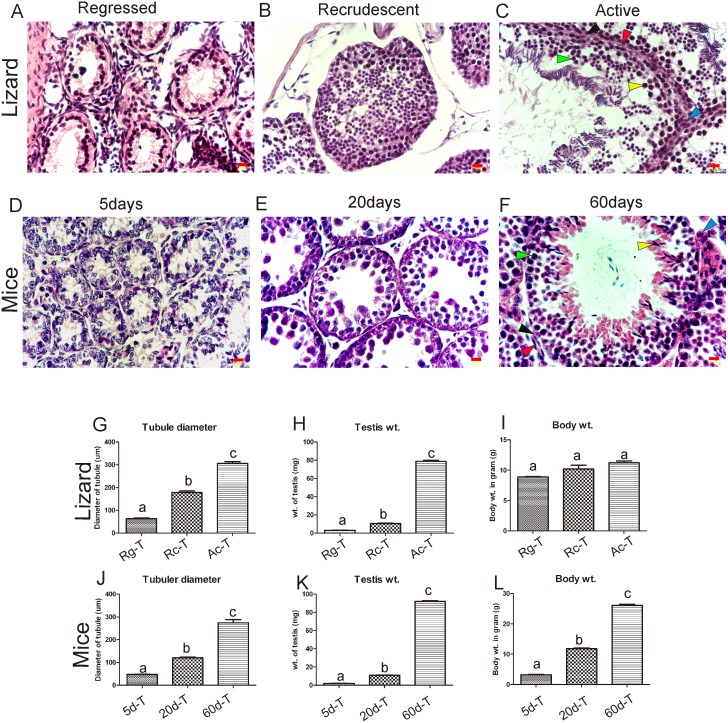
Fig 2. Comparative analysis of testicular development in wall lizard and mice at different reproductive phase of testes.
(A), (B) and (C) represent the cross section of testis isolated from regressed, recrudescent and active phase of reproductive cycle in wall lizard, respectively. Figure (D), (E) and (F) represent testis isolated from 5 day, 20 day and 60 day old mouse respectively. In the figure (C & F), as for representation, Leydig cell (blue), peritubular cell (red), Sertoli cell (black), germ cell (green), and spermatids (yellow) are shown with respective arrowhead. Figure (G) & (J) shows comparison of tubular diameter (n = 6), (H) & (K) shows comparison of testis weight (n = 6), (I) & (L) depicts the comparative analysis body weight (n = 3) between wall lizard and mice, respectively. One way analysis of variance followed by newman-keuls multiple comparison test was performed to get P value as significance level p<0.05. In a graph, different letters above the bars denotes significant difference in values (p<0.05), Bars refers to S.D. between replicates (n = 3). Scale bar on the figure A-F indicates 0.01mm. Rg-T, Rc-T, Ac-T are testes isolated from regressed, recrudescent, and active phase of wall lizard, respectively. 5d-T, 20d-T, and 60d-Tdenotes testes isolated from 5 days, 20 days and 60 days old mouse, respectively.

