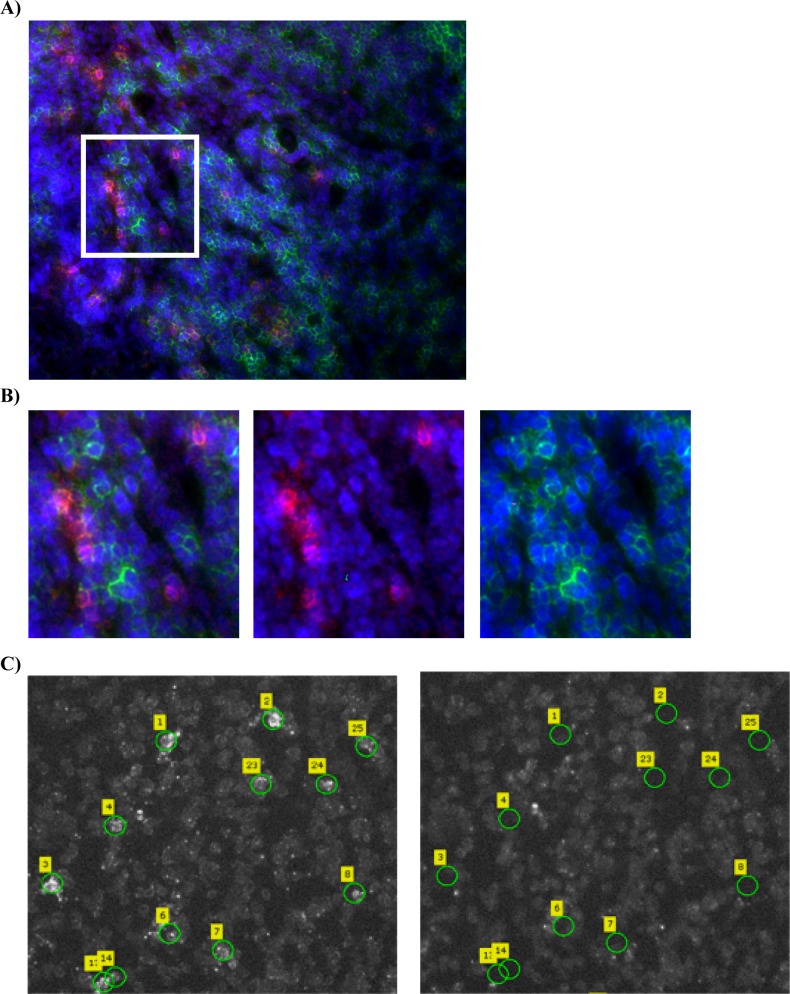
Fig 1. Laser capture microdissection of GagCM9+cellsSIV+RMs, CD8+cellsSIV+RMs and CD8+cellsSIV-RMs.
A) Fluorescence images of lymph node tissue sections from an SIV infected RM stained with GagCM9 Qdot 655 multimer (red), CD8 (green) and dapi (blue) showing the abundance of GagCM9+ cells. B) A magnified view of the region indicated in panel A, demonstrating that the GagCM9+cellsSIV+RMs cells also express CD8+. C) Images of lymph node tissue sections from an SIV infected RM stained with CM9 Qdot 655 multimer to detect GagCM9+cellsSIV+RMs. The left images show the tissue section with the selected GagCM9+cellsSIV+RMs prior to LCM and the images to the right show the same tissue section after the selected cells have been microdissected and collected.

