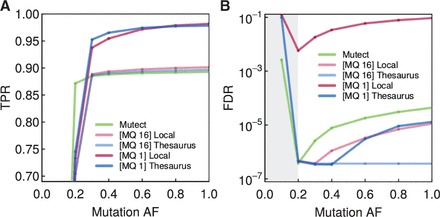
Fig. 2.

Performance for calling somatic mutations from synthetic normal/tumor sample pairs. (A) True positive rate (TPR) of various mutation detection approaches (note vertical axis does not start at 0 to emphasize the practically relevant TPR range). Dots represent synthetic tumor samples with different mutation allelic frequencies (AF). The approaches are Mutect, a local mutation calling at two mapping quality (MQ) thresholds, and thesaurus-assisted mutation calling at two mappability thresholds. Other methods are discussed in the Supplementary Text. (B) False discovery rates (FDR) for the same methods. The gray band indicates results with zero false positives and a small number of true positives, a performance regime that produces spuriously high FDRs based on Eq. (4)
