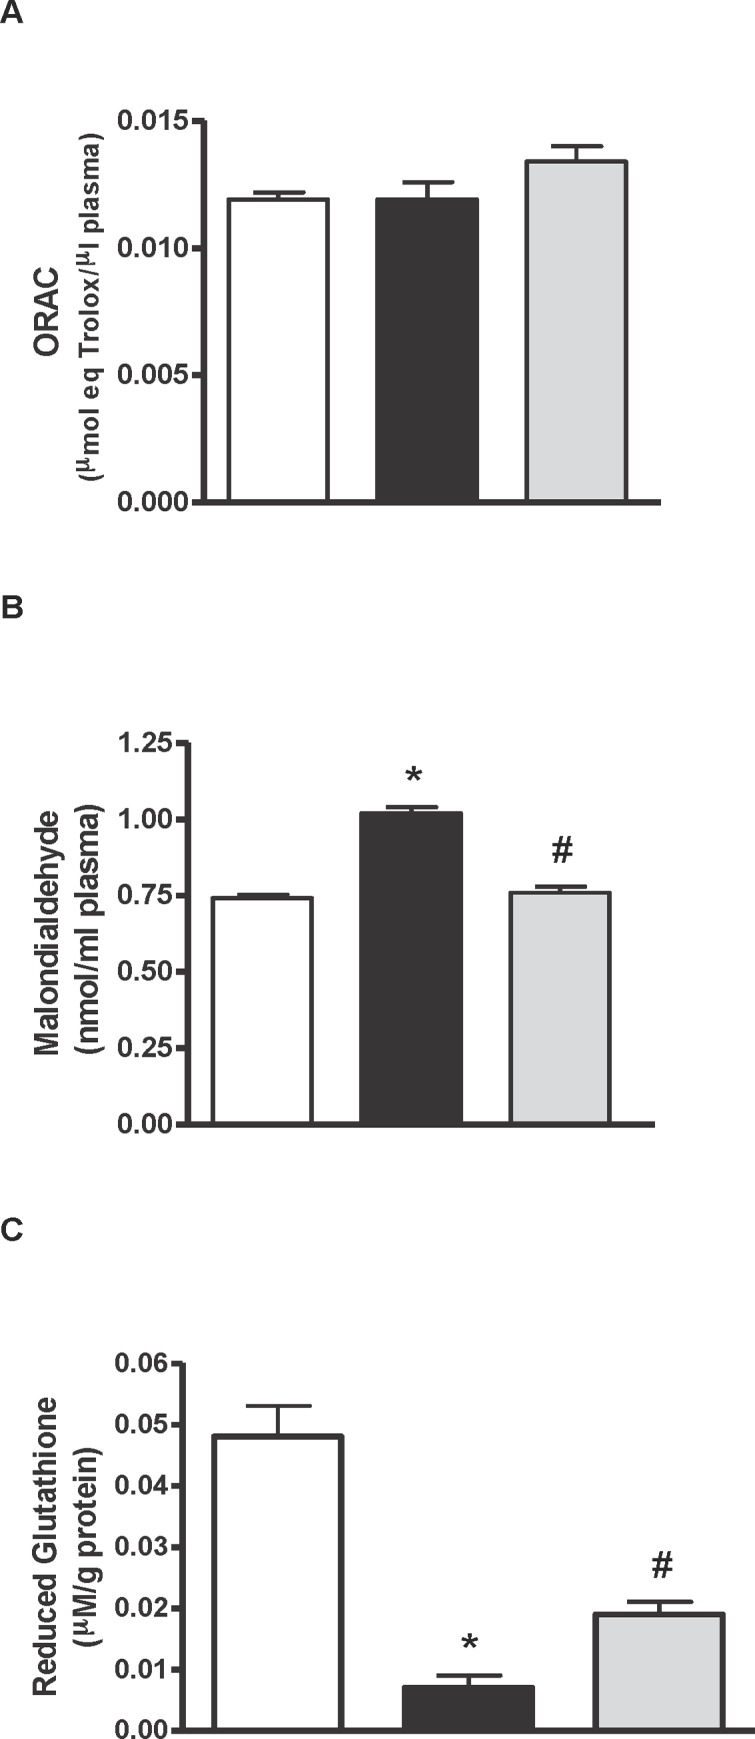
Fig 6. Antioxidant activity, MDA and reduced glutathione.

Histograms of A) antioxidant activity (μmol eq Trolox/μl), B) malondialdehyde (nmol MDA/ml) in plasma and C) reduced glutathione (μM/g protein) in liver of lean Zucker rats (white), obese Zucker rats that received water (black) and obese Zucker rats that received 750 mg/kg/day of pepsin egg white hydrolysate (light grey) for 12 weeks. Values are means ± SEM (n = 10). * P<0.05 obese vs lean rats, #P<0.05 obese rats treated with pepsin egg white hydrolysate vs control obese rats.
