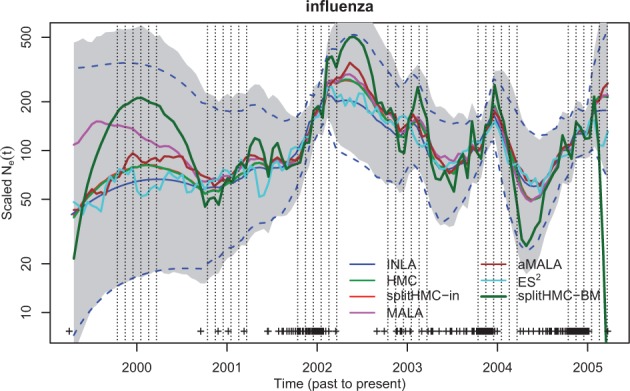
Fig. 5.

Population dynamics of influenza A in New York (2001–2005): shaded region is the 95% credible interval calculated with samples given by splitHMC with . SplitHMC with (red) is more conservative than splitHMC with (dark green) in estimating the variation of population size trajectory
