
Fig 2. Phenotypic correlations between biomass-related traits quantified in recombinant inbred lines.
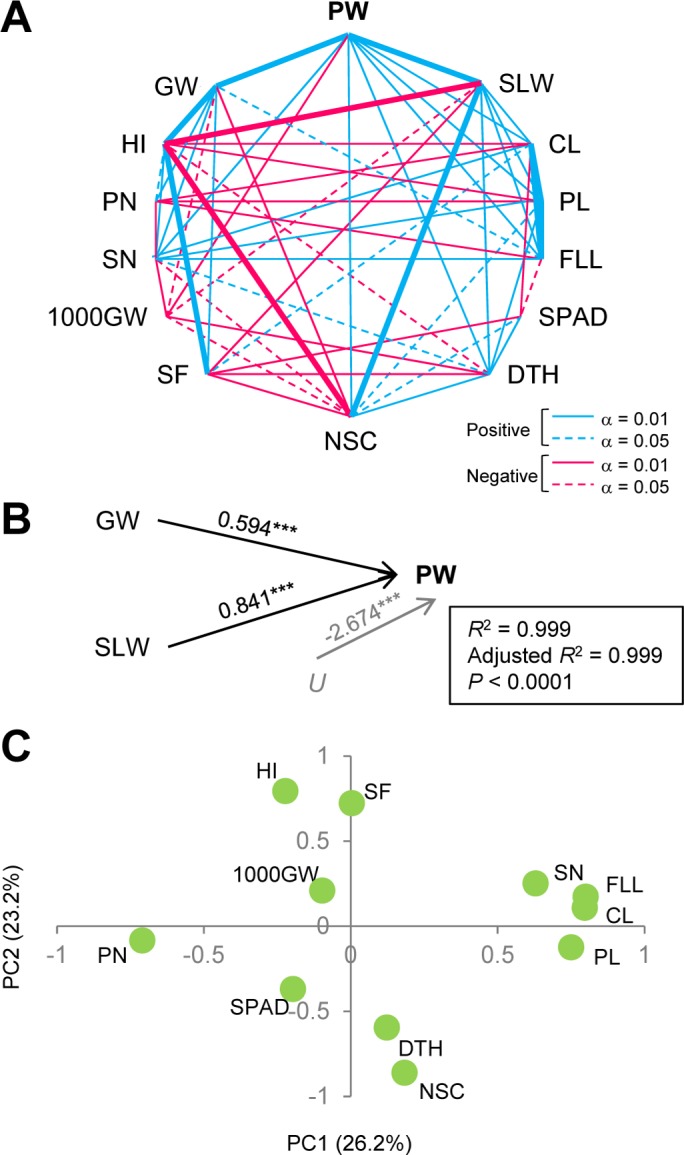
(A) Relationships between the traits according to Pearson’s correlation coefficients. Two traits that showed significant correlation are connected to each other. Significant correlation coefficients are indicated by solid lines (more than ±0.212; α = 0.01) or broken lines (more than ±0.156; α = 0.05). Correlation coefficients of more than ±0.500 are shown by thick solid lines. PW, plant weight; SLW, stem and leaf weight; CL, culm length; PL, panicle length; FLL, flag leaf length; SPAD, chlorophyll content; DTH, days to heading; NSC, non-structural carbohydrate content; SF, spikelet fertility; 1000GW, 1000-grain weight; SN, spikelet number per panicle; PN, panicle number; HI, harvest index; GW, grain weight. (B) Path diagram showing two independent variables, GW and SLW, and the residual variable U, affecting plant weight (PW). Numbers indicate partial regression coefficients. ***, P < 0.0001. (C) Biplot based on principal component analysis for the traits. The percent variation explained by each principal component is shown in parentheses.