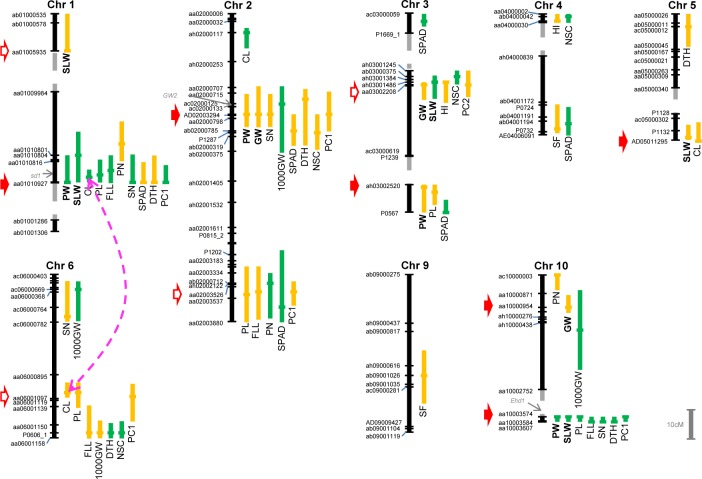
Fig 3. Locations of QTLs for biomass-related traits quantified in this study.
Vertical bars to the right of the linkage map of each chromosome denote one-LOD confidence intervals; horizontal bars denote the position of the LOD peak at each QTL. Green signifies a QTL for which the ‘Tachisugata’ allele had a positive effect; yellow signifies a QTL for which the ‘Hokuriku 193’ allele had a positive effect. Gray broken lines how linkage gaps. Ten SNP markers subjected to multiple regression analysis are marked with red arrows; six of them (filled arrows) were chosen for QTL-based selection. A pink broken line connecting QTLs on Chrs 1 (aa01010927) and 6 (aa06001097) indicates significant epistasis (p = 0.0067). PW, plant weight; GW, grain weight; SLW, stem and leaf weight; HI, harvest index; CL, culm length; PL, panicle length; FLL, flag leaf length; PN, panicle number; SN, spikelet number per panicle; 1000GW, 1000-grain weight; SF, spikelet fertility; SPAD, chlorophyll content; DTH, days to heading; NSC, non-structural carbohydrate content. For visual clarity, Chrs 7, 8, 11, and 12, where no significant QTLs were detected, and the names of some markers are omitted.

