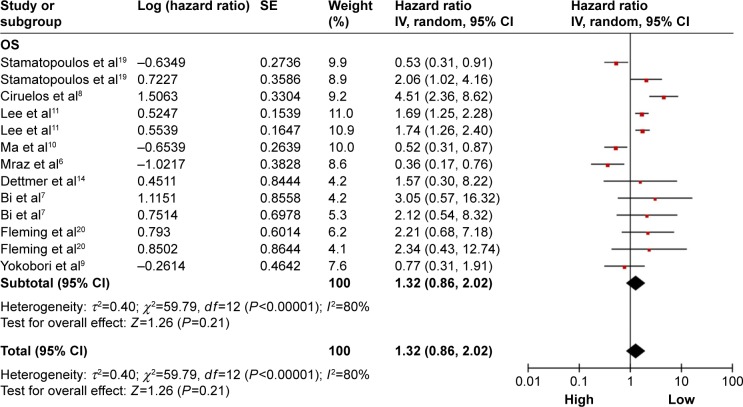
Figure 2.
Forest plots of merged analyses of OS in association with microRNA-150 expression.
Notes: Squares and horizontal lines represent study-specific HRs and 95% CIs, respectively. The areas of the squares correspond to weights, and the diamonds represent the overall HRs and 95% CIs.
Abbreviations: CIs, confidence intervals; df, degrees of freedom; HRs, hazard ratios; OS, overall survival; SE, standard error; IV, inverse variance.

