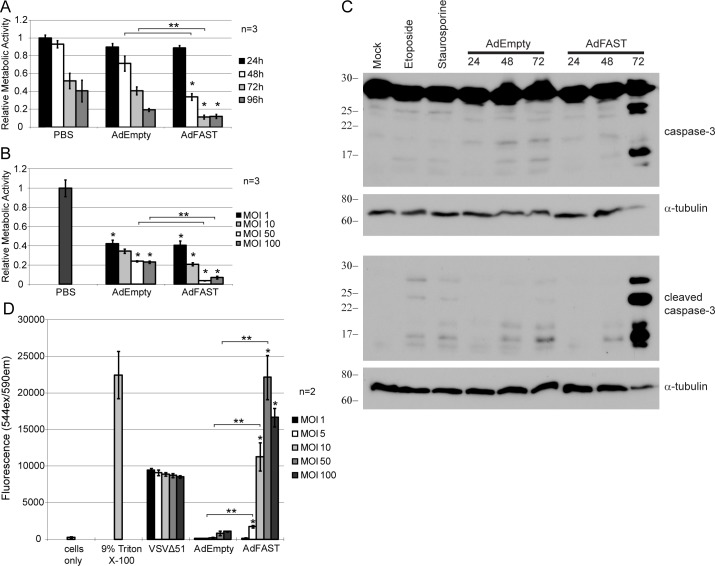
Fig 4. FAST protein expression in A549 cells decreases cellular metabolic activity, promotes apoptosis and concomitant loss of membrane integrity.
A) A549 cells were infected at an MOI of 10 with AdEmpty or AdFAST. Cellular metabolic activity was assessed every 24 h until 96 hpi using an MTS assay. The average of three independent experiments (n = 3) done in triplicate is plotted with the standard error of the mean. Values were normalized to mock infected cells at 24 hpi. *p<0.05 compared to mock infected cells at their corresponding timepoints. **p<0.05 comparing AdFAST to AdEmpty infected cells. B) A549 cells were infected with AdEmpty or AdFAST at an MOI of 1, 10, 50 or 100. An MTS assay was conducted 72 hpi. The average of three independent experiments (n = 3) done in triplicate ± the standard error of the mean is shown with normalization to mock infected cells. *p<0.05 compared to mock infected cells. **p<0.05 comparing AdFAST to AdEmpty treated cells. C) A549 cells were treated with AdEmpty or AdFAST at an MOI of 10, or left uninfected, and crude protein extracts prepared 24 hr later and examined for total or cleaved caspase 3 by immunoblot. As positive controls, A549 cells were treated with 100 μM etoposide for 24 h, or 1 μM staurosporine for 6 h. Alpha-tubulin served as a loading control. D) A549 cells were infected with AdEmpty, AdFAST or VSVΔ51 using a range of MOI. Relative cell membrane integrity was measured based on the lactate dehydrogenase levels in the supernatant 72 hpi. The average of two independent experiments (n = 2) is shown with each experiment done in triplicate. Error bars denote the standard error of the mean. *p<0.05 compared to cells only. **p<0.05 when comparing AdFAST to AdEmpty infected cells.

