
Fig. 4. Analyses of WT and WT+22 hydrogels.
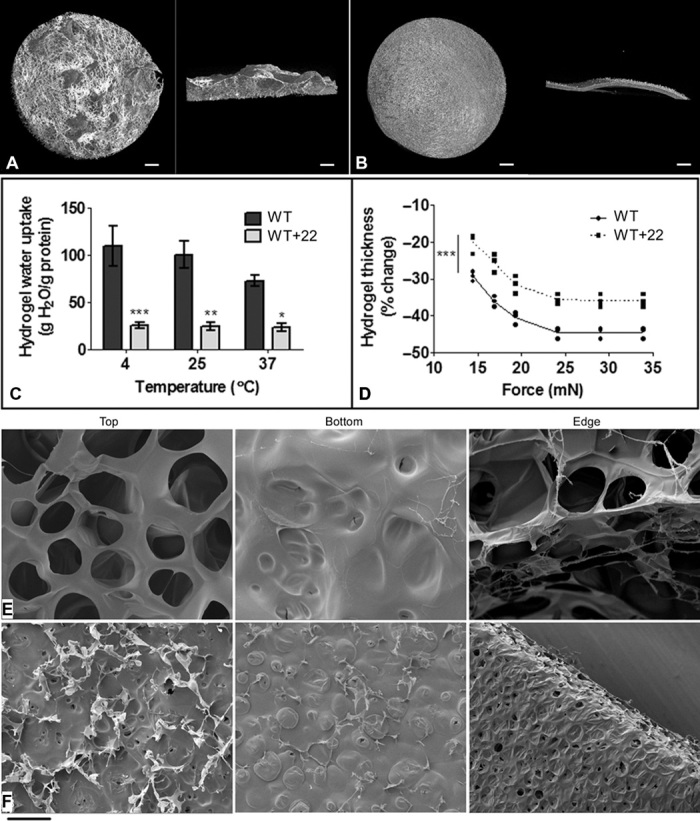
(A and B) Micro-CT imaging of (A) WT and (B) WT+22 hydrogels. Each panel shows the top view (left) and the cross-sectional view (right). Scale bar, 0.5 mm. (C) Swelling of WT and WT+22 hydrogels in water at 4°, 25°, and 37°C. The amount of water absorbed by each hydrogel was normalized according to hydrogel mass. (D) Compressive strength of WT and WT+22 hydrogels as measured by the extent of hydrogel deformation against increasing application of force. (E and F) Scanning electron microscope images of (E) WT and (F) WT+22 hydrogels. Each panel shows the top, bottom, and edge of the hydrogel. Scale bar, 100 μm.