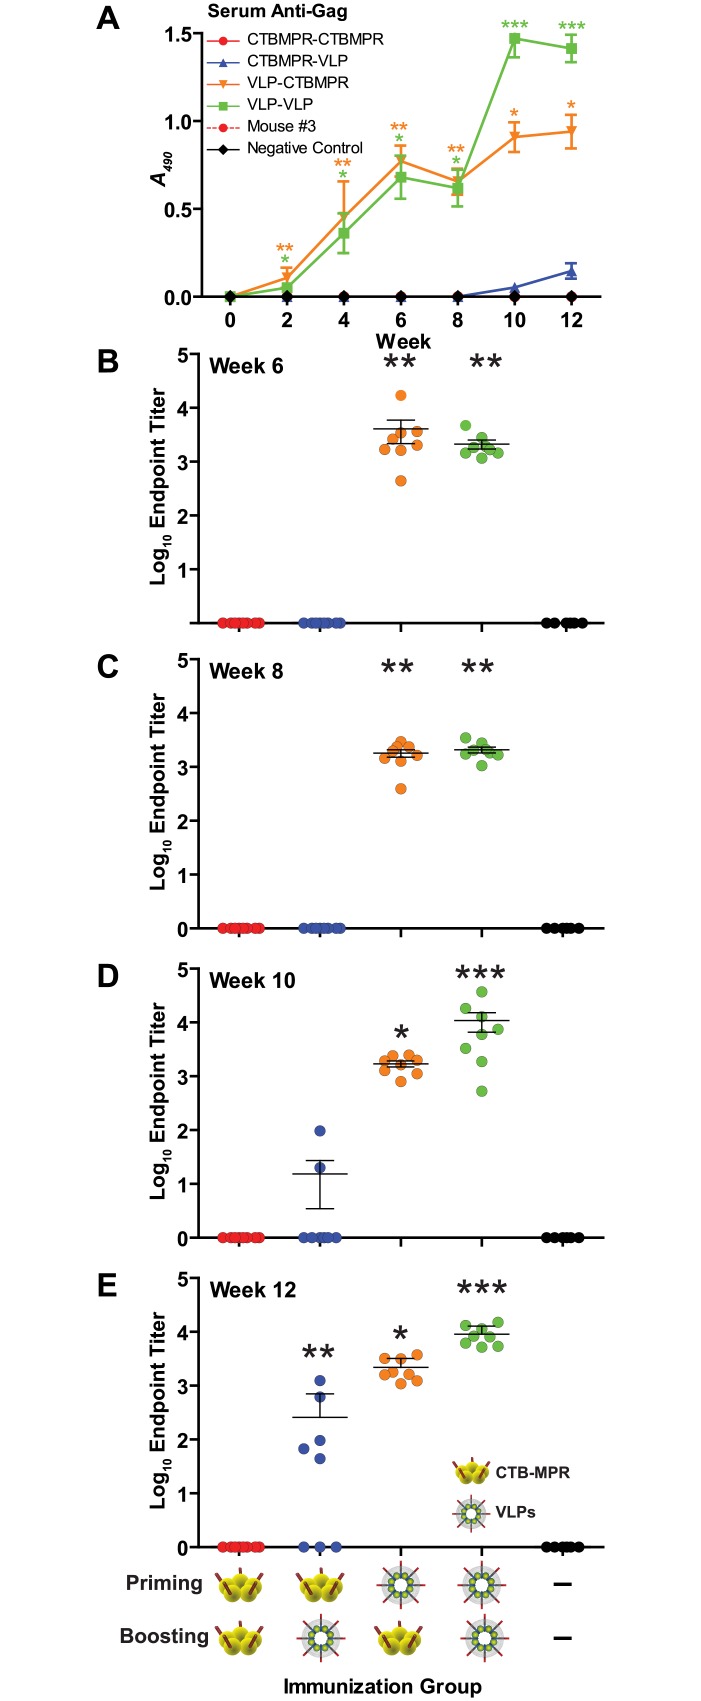
Fig 3. Serum anti-p24 (anti-Gag) responses.
(A) Mice were immunized as per Fig 2A. Serum samples were diluted 1:50 and IgGs were detected by direct ELISA on indicated weeks. Shown are average net OD490 values (mean +/- SEM). Also shown are Ab endpoint titers at response peaks after priming (B, Week 6); before first boost (C, Week 8), after first boost (D, Week 10), and after second boost (E, Week 12). Symbols indicate statistical significance (compared to week zero within the group) evaluated by Kruskal-Wallis test and Dunn’s Multiple Comparison test: * p < 0.05, ** p < 0.01, *** p < 0.001.

