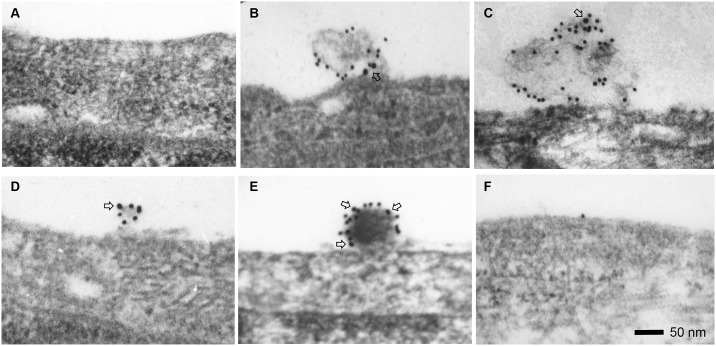
Fig 3. Colocalization of β-COP and apoA-1 or apoE on the cell surface observed by immunogold electron microscopy.
β-COP is indicated by large gold particles (18 nm, open arrows) while apoA-1 and apoE are represented by small gold particles (12 nm). (A) No detection of β-COP on fibroblast without addition of apoA-1 to the culture medium during incubation. (B) ApoA-1 and β-COP colocalization on protrusion complex on the fibroblast surface with incubation of 10 μg/ml apoA-1 in the medium. (C) ApoE and β-COP colocolization on the fibroblast surface following incubation of 10 μg/ml apoE. (D) ApoA-1 and β-COP colocalization on protrusion complex on the THP-1 macrophage surface with incubation of 10 μg/ml apoA-1. (E) ApoE and β-COP colocalization on protrusion complex on THP-1 macrophage surface following incubation of 10 μg/ml apoE. (F) No protrusion complex on cell surface on two different Tangier fibroblast cell lines after treatment with apoA-1 or apoE. The experiments were repeated four times.

