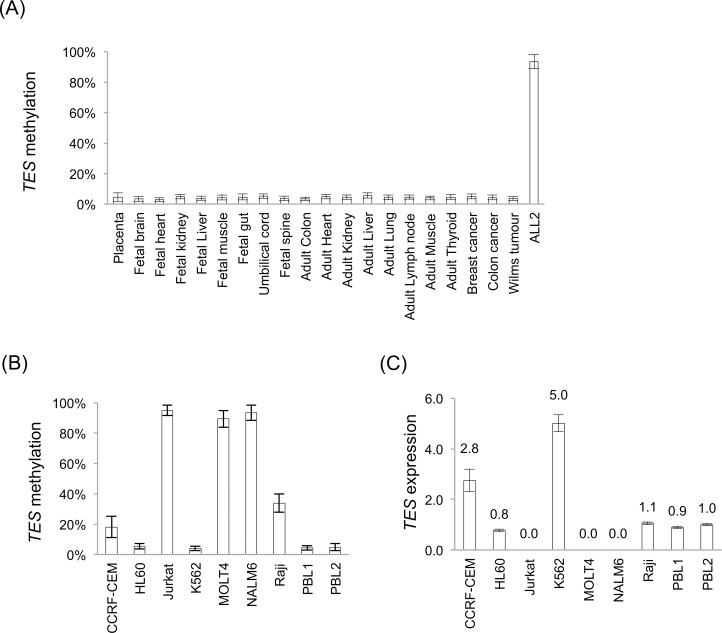
Fig 1. TES promoter methylation and expression.
Sequenom MassARRAY methylation data of (A) normal, somatic tissues, and (B) lymphoblastoid cell lines (95% confidence intervals are shown). (C) TES expression levels by quantitative RT-PCR were calculated relative to B2M expression and normalised to relative expression levels in the normal peripheral blood leukocyte sample (PBL2) (error bars are standard deviations).

