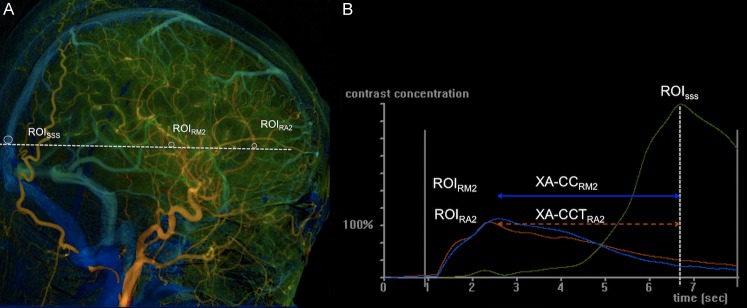
Fig 1. Lateral view of quantitative color-coded right common carotid DSA and the time density curves of ROIs.
(A) Lateral view of quantitative color-coded right common carotid DSA. ROIRA2 was located at the greatest curvature of ACA. ROISSS and ROIRM2 were chosen by drawing an imaginary line (dashed line) parallel to the osteomeatal line to intersect SSS and the insular branch of the right-middle cerebral artery (RM2) respectively. (B) Time density curves of ROIRA2, ROIRM2, and ROISSS. The dashed line intersecting the X-axis perpendicularly indicate the Tmax of ROISSS. The XA-CCTRA2 (double-headed line) was defined as the time difference between the Tmax of ROIRA2 and that of ROISSS; the XA-CCTRM2 (dashed double headed line) was defined as the time difference between the Tmax of ROIRM2 and that of ROISSS.

