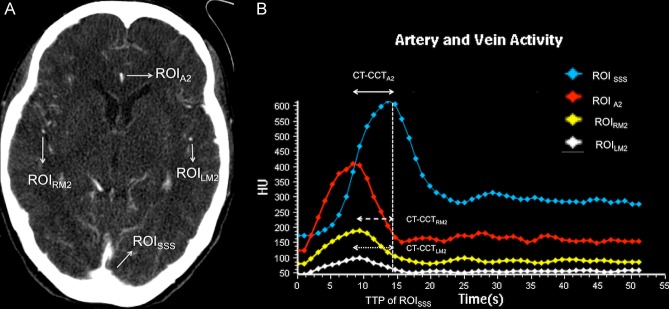
Fig 2. Axial view of the time-maximum intensity projection CTP and the time density curve of ROI.
(A) An axial view of the time-maximum intensity projection CTP at the level where the ACA curved anteriorly and posteriorly. ROIA2 was chosen at the dominant ACA; ROIRM2, ROILM2, and ROISSS were designated at the corresponding vessels. (B) Time density curve of ROIA2, ROIRM2, ROILM2, and ROISSS. The dashed line intersected perpendicularly with the X-axis indicated the TTP of SSS. The CT-CCTA2 (double headed line) was defined as the time difference between the TTP of ROIA2 and that of ROISSS; The CT-CCTRM2 (dashed double headed line) was defined as the time difference between the TTP of ROIRM2 and that of ROISSS. The CT-CCTLM2 (dotted double headed line) was defined as the time difference between the TTP of ROILM2 and that of ROISSS.

