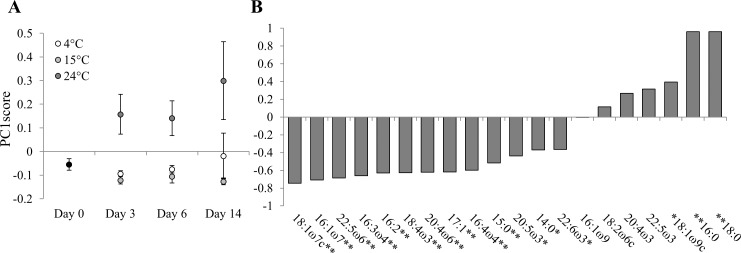
Fig 3. Storage FA composition of the copepod P. littoralis prior (day 0) and after 3, 6 and 14 days of food deprivation at different temperatures (4, 15 and 24°C).
(A) The PC1score values (±SD) for storage lipids are displayed with (B) the Spearman’s rho correlation coefficients of individual FAs (%) used for the PCA with the correlation significance levels (*p <0.05; **p <0.01).

