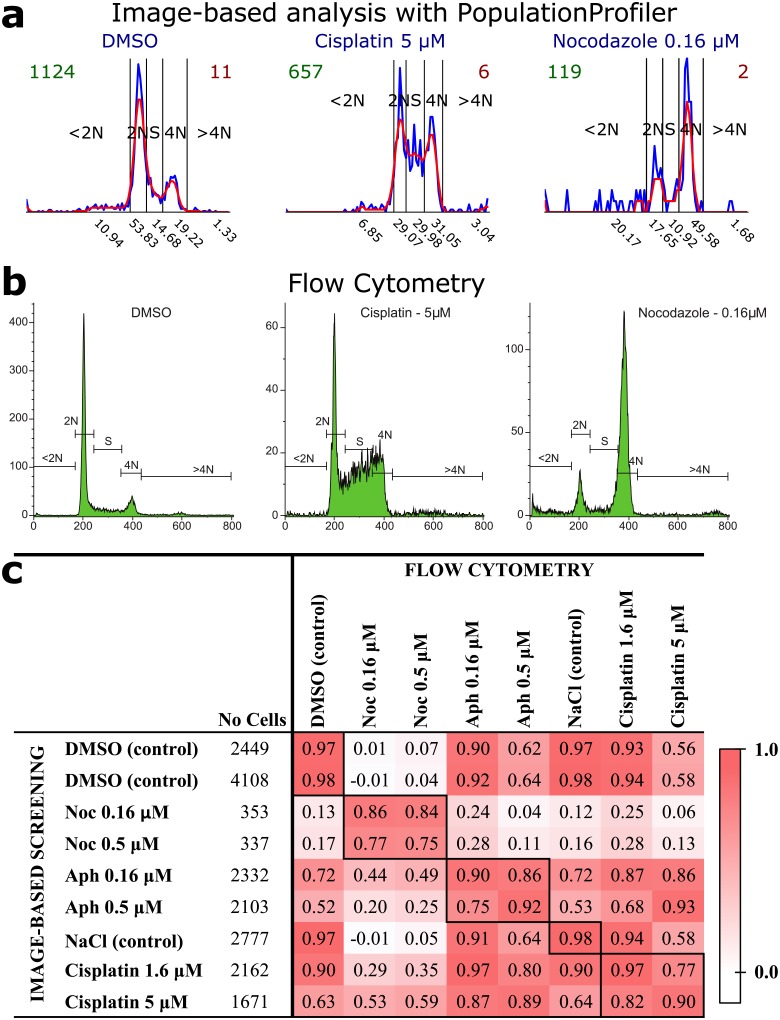
Fig 1. Image-based cell cycle analysis of cell line A549 with PopulationProfiler and its comparison to flow cytometry.
a) DNA content histograms created with PopulationProfiler. The blue and red lines show data before and after smoothing, respectively. The numbers under the x-axis present the percentage contribution of each cell cycle sub-population. b) The corresponding cell cycle analysis with flow cytometry. c) A comparison of the results (the contributions of the 5 cell cycle sub-populations) reveals high correlation. The respective total cell counts used by PopulationProfiler and flow cytometry are 18292 and 102751.

