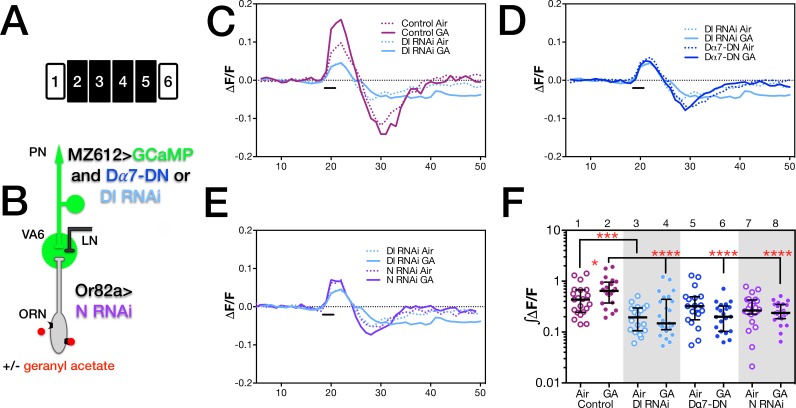
Fig 5. Delta in PNs is required for PN physiological plasticity.
(A) Schematic of the experimental protocol. (B) The relevant genotypes are shown on the cartoon of the olfactory circuit. In C through F female flies were exposed to 1% GA in paraffin oil or paraffin oil alone and removed from odor for one day prior to imaging. The traces in C, D and E depict the median ΔF/F for each genotype and condition over time. (The numbers on the x-axis are frames of 472 msec each). The black bar indicates the time of a 1.5 second GA pulse. Solid traces, GA exposed flies; dotted trace, air exposed flies; magenta traces, control; pale blue traces, Dl RNAi; purple traces, N RNAi. (F) ∫ΔF/F, plotted in log scale, of calcium influx of flies shown in C, D and E. Statistically significant comparisons are indicated by asterisks. All other biologically relevant comparisons were not statistically significant. The number of quantified glomeruli are: lane 3, 18; lanes 4, 25; control and Dα7-DN flies are the same as in Fig 2E. Control, Dl RNAi and Dα7-DN experiments were carried out at the same time. In D the Dl RNAi (pale blue) and Dα7-DN (blue, data from Fig 2) are superimposed and in E traces of Dl RNAi in PNs (pale blue) are superimposed with those of N RNAi in ORNs (purple, data from Kidd et al, 2015 [10]). Flies were MZ612-GAL4 UAS.GCaMP6s/Or82a-LexAGAD; UAS.GCaMP6s LexOP.dsRED with UAS.Dl shRNA (Dl RNAi), with UAS.Dα7-DN (Dα7-DN) or with neither (control) and MZ612-GAL4 UAS.GCaMP6s/Or82a-LexAGAD; UAS.GCaMP6s LexOP.dsRED with LexOP.N shRNA (N RNAi, data from Kidd et al., 2015 [10]).

