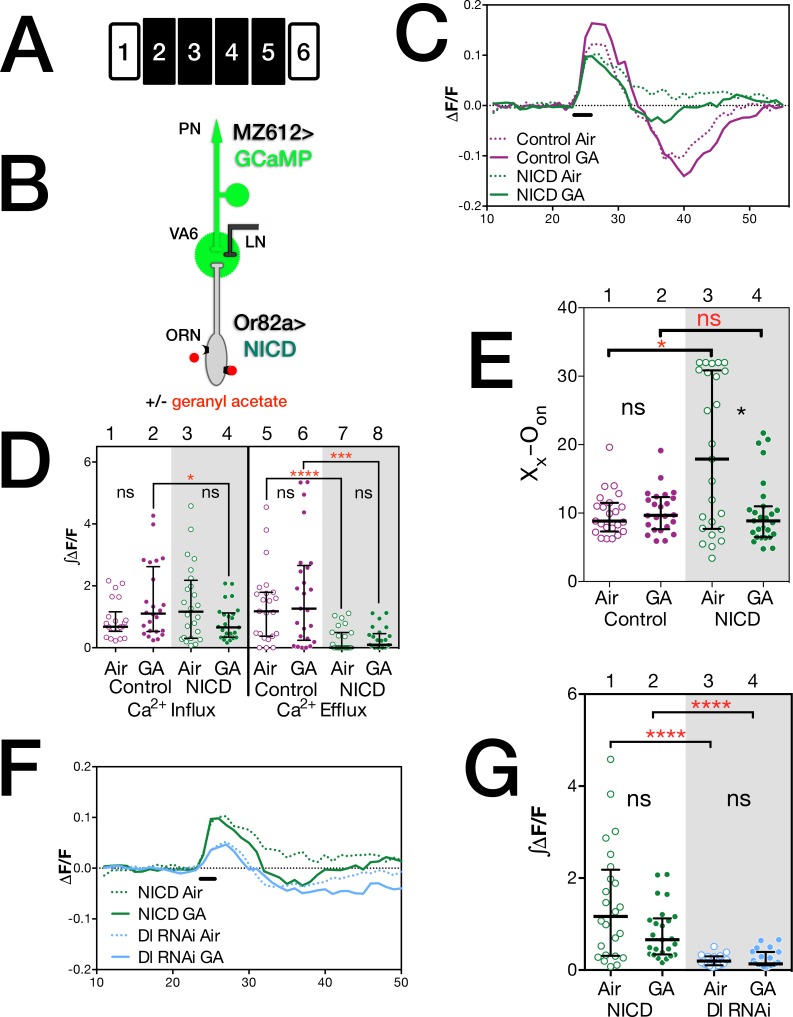
Fig 6. Expression of NICD in ORNs results in a prolonged increase in calcium levels in PNs.
(A) Schematic of the experimental protocol. (B) The relevant genotypes are shown on the cartoon of the olfactory circuit. In C through G female flies were exposed to 1% GA in paraffin oil or paraffin oil alone and removed from odor for one day prior to imaging. The traces in C and F depict the median ΔF/F for each genotype and condition over time. (The numbers on the x-axis are frames of 472 msec each). The black bar indicates the time of a 1.5 second GA pulse; solid traces, GA exposed flies; dotted traces, air exposed flies; magenta traces and circles, control; green traces and circles, NICD; pale blue traces and circles, Dl RNAi. (D) ∫ΔF/F, of calcium influx and efflux of flies shown in C. The statistics are based on the following number of glomeruli: lanes 1 and 5, 22; lanes 2 and 6, 24; lanes 3 and 7, 24; lanes 4 and 8, 25. (G) ∫ΔF/F of calcium influx of flies plotted in F. (E) The number of frames between odor onset (Oon) and the end of calcium influx Xx. Open circles air exposed, filled circles GA exposed flies. The statistics are based on the following number of glomeruli: lane 1, 23; lane 2, 24; lane 3, 25; lane 4, 27. Flies were MZ612-GAL4 UAS.GCaMP6s/Or82a-LexAGAD; UAS.GCaMP6s LexOP.dsRED carrying either LexOP.mCherry shRNA (control) or LexOP.NICD (NICD) and MZ612-GAL4 UAS.GCaMP6s/Or82a-LexAGAD; UAS.GCaMP6s LexOP.dsRED with UAS.Dl shRNA (Dl RNAi, data from Fig 5).

