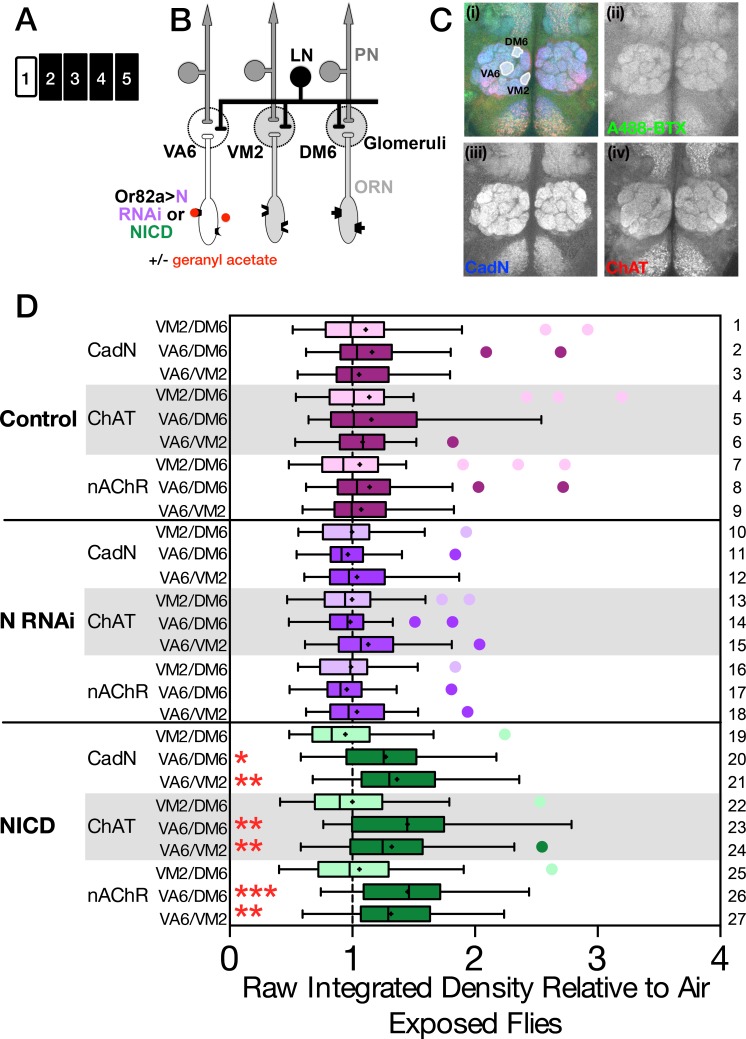
Fig 7. Chronically exposing flies expressing NICD in ORNs to geranyl acetate leads to an increase in ChAT in VA6.
(A) Schematic of the experimental protocol. (B) The relevant genotypes and glomeruli are shown on the cartoon of the olfactory circuit. (C) Female flies were exposed to 1% GA in paraffin oil or paraffin oil alone for four days. Brains were then co-reacted with anti-cadN, anti-ChAT and A488-BTX to visualize nAChRs. A representative brain is shown in C(i) with the three glomeruli which were quantified outlined. Grey scale images of each channel are also shown separately: (ii) A488-BTX (green), (iii) cadN (blue), and (iv) ChAT (red). (D) For each brain we quantified the pixel intensities of VA6, VM2 and DM6 and then determined the ratios of all three combinations. Each ratio for geranyl acetate and air exposed flies was normalized to the median value for air exposed flies. Data for the geranyl acetate exposed flies are shown as box and whisker plots. The box represents the median and inner quartiles, the whiskers the outer quartiles. The cross is the mean, and outliers are shown as circles. Normalized air exposed flies by definition have a median of one, which is indicated by the dashed line. The complete data sets of unnormalized and normalized ratios are shown in the scatter plots of S1 Fig. Statistical significance was determined by the Kruskal-Wallis test with Dunn’s correction for multiple comparisons. Control flies are magenta, N RNAi are purple and NICD flies green. The control comparisons of VM2/DM6 are more lightly shaded than the experimental VA6/DM6 and VA6/VM2 comparisons. Flies were Or82a-GAL4 with either UAS.Val20, UAS.N shRNA or UAS.NICD.

