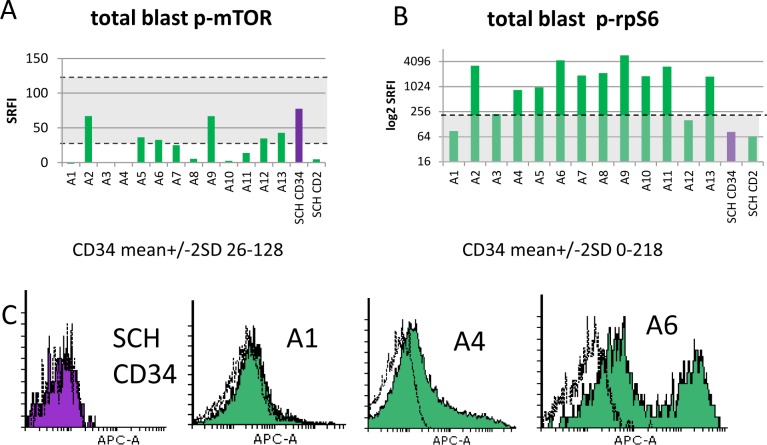
Fig 2. MTORser2488 and rpS6ser235/236 phosphorylation in AML blasts and normal CD34+ cells.
Summary histograms for p-mTOR (A) and p-rpS6 (B) show standardised relative fluorescence intensity values (SRFI) for 13 individual primary AML samples and pooled data for five stem cell harvests (SCH). The latter were gated for subsets expressing CD34 or CD2. The shaded area indicates ± 2 standard deviations of the mean for the normal CD34+ cells. C. Flow cytometric distributions of p-rpS6 for one representative stem cell harvest (CD34+ gated cells) and three patient samples (P3 blast-gated cells–see Fig 1D). Flow cytometric histograms illustrate fluorescence signals from test antibody (shaded) compared to isotype control (unshaded).

