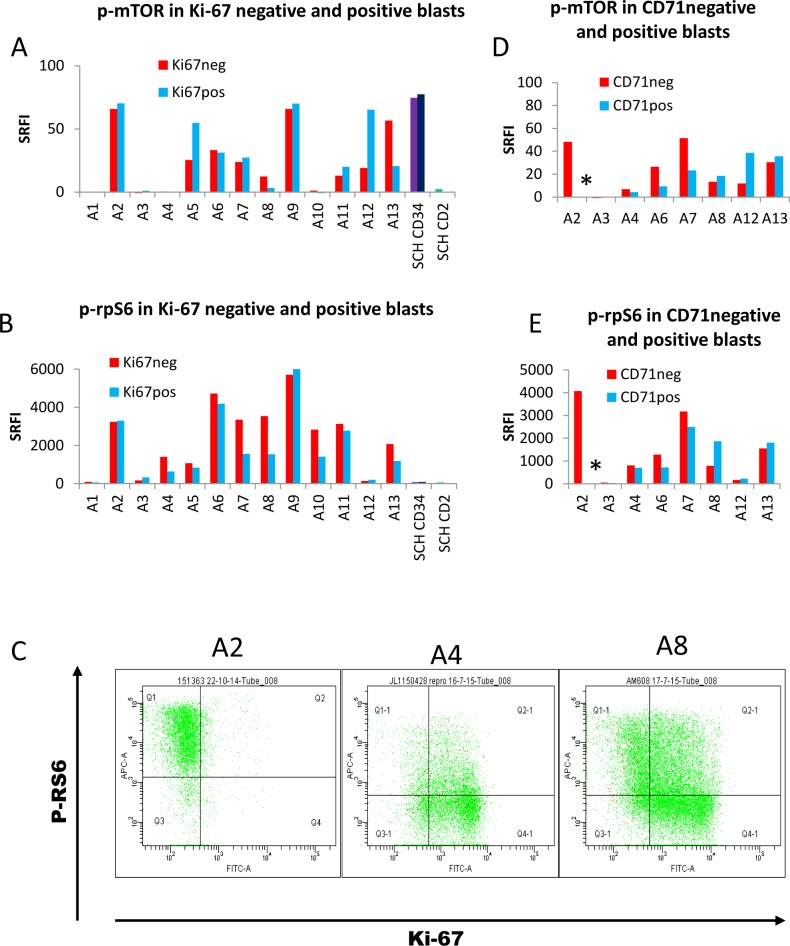
Fig 3. P-mTOR and p-rpS6 in dormant and proliferating cells.
Summary histograms for p-mTOR (A,D), and p-rpS6 (B,E) show standardised relative fluorescence intensity unit values (SRFI) for Ki-67¯ and Ki67+ (A,B) and CD71¯ and CD71+ positive (D,E) blasts from 13 primary AML samples and five stem cell harvests. C. Flow cytometric distributions of p-rpS6 versus Ki-67 for three patient samples (P3 blast-gated cells). * = <1% CD71+ cells detected.

