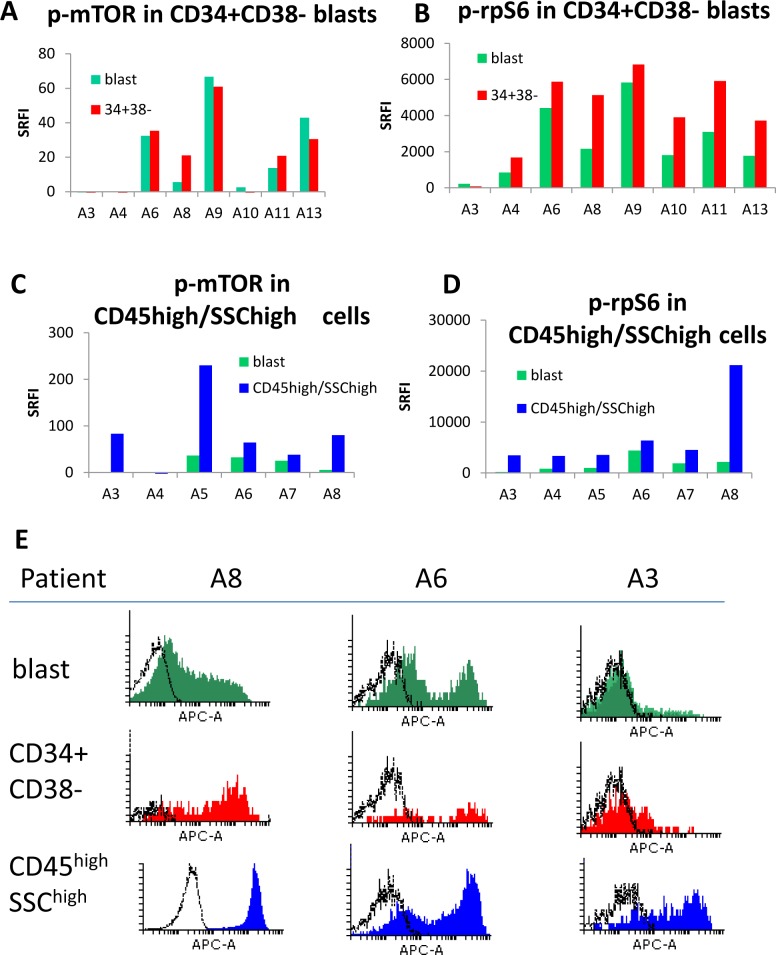
Fig 4. Subset analysis.
Summary histograms of p-mTOR (A,C), and p-rpS6 (B,D) for (A,B) CD34+CD38- and (C,D) CD45high/side scatterhigh subsets compared with total blasts. Standardised relative fluorescence intensity values (SRFI) were used. (E) Flow cytometric distributions of p-rpS6 for three patient samples. The histograms illustrate fluorescence signals from test antibody (shaded) compared to isotype control (unshaded).

