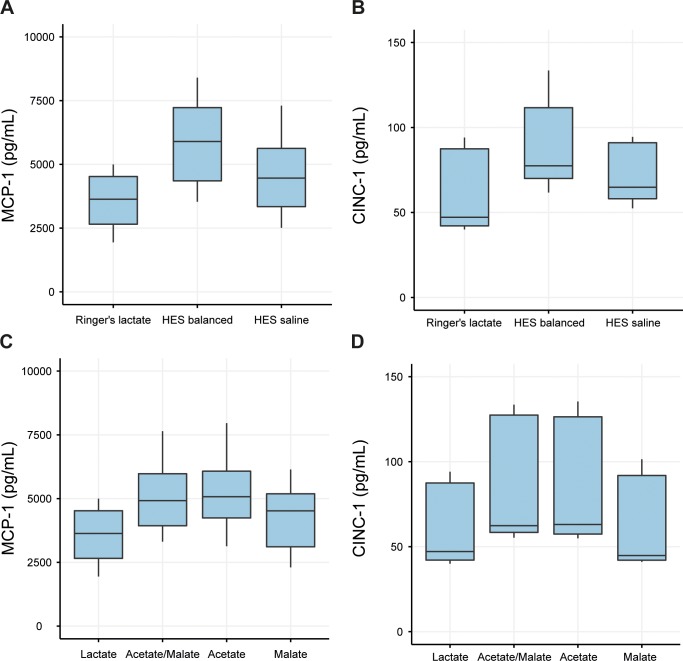
Fig 5. Inflammatory response of rat pulmonary endothelial cells to fluid formulations or components and subsequent stimulation.
Levels of the inflammatory cytokines MCP-1 (Fig 5A and 5B) and CINC-1 (Fig 5C and 5D) after exposure to fluid formulations (RL, HES balanced and HES saline, Fig 5A and 5C) and anions present in balanced solutions (5B and 5D). Results are presented as boxplot figures with medians and quartiles. Whiskers represent 5% and 95% confidence intervals.

