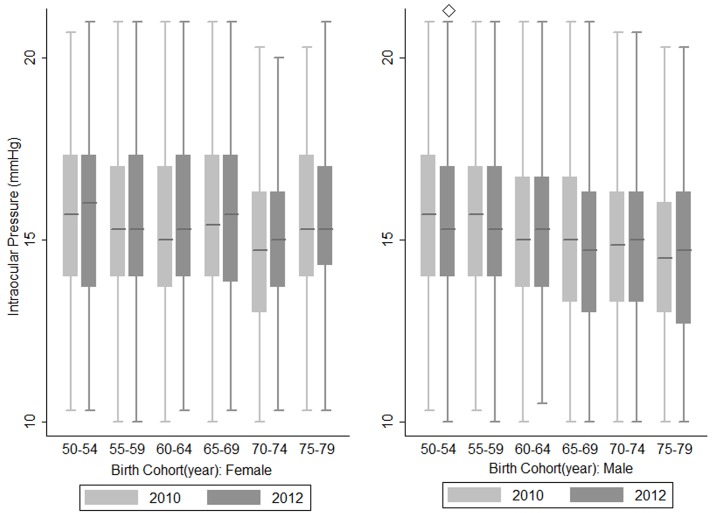
Fig 3. Comparison of intraocular pressure by sex and birth cohorts in 2010 and 2012.
Box plots showing the IOP of the right eye between the year 2010 and 2012 in each birth cohort of the population, ◇ represents a P value <0.05 calculated by paired t-test comparing the mean IOP of the year 2010 and 2012.

