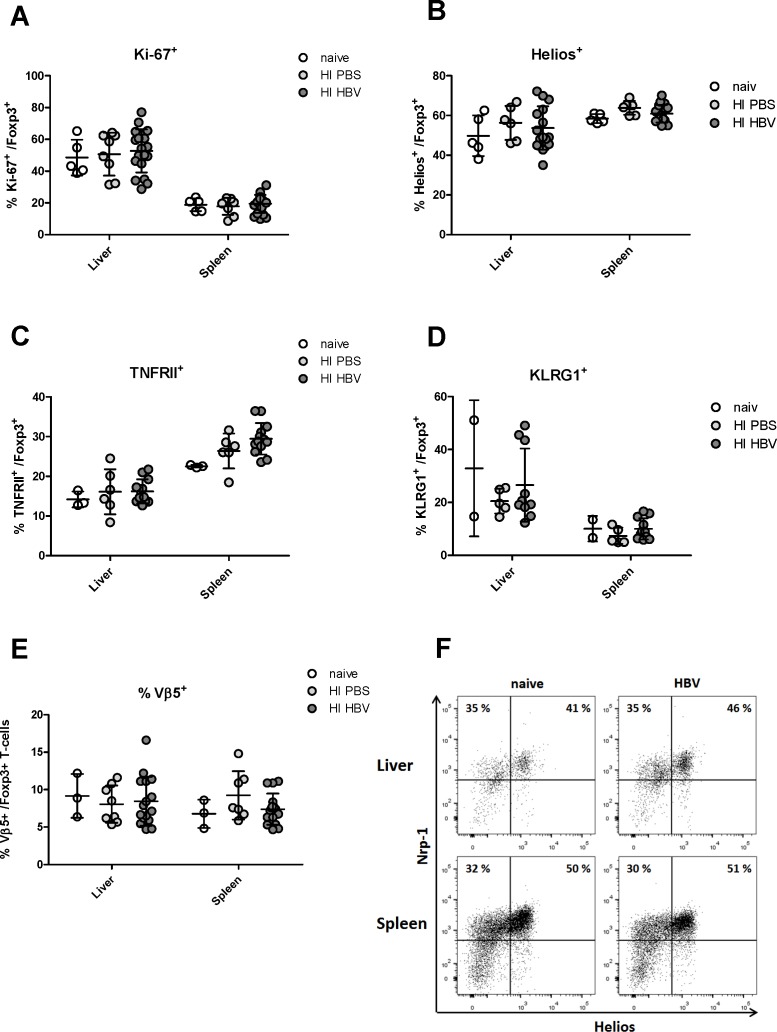
Fig 2. Phenotype analysis of Tregs in the liver and spleen of HBV-replicating mice.
C57BL/6 mice were hydrodynamically injected with PBS or pSM2 plasmid. Flow cytometry was used to quantify activation and differentiation markers Tregs in the liver and spleen 21 days after injection. The frequencies of CD4+ Foxp3+ Treg populations in the liver and spleen expressing (A) Ki67+ cells, (B) Helios+ cells, (C) TNFR2+ cells, (D) KLRG1+ cells, and (E) Vß5+ cells were enumerated and expressed as a percentage of the Treg population. Each dot represents an individual mouse. Data were pooled from 3–5 independent experiments with similar results. (F) Representative scatter plots of Neuropilin-1 against Helios are shown from a naive mouse and a HBV-replicating mouse. Cells were gated on CD4+ Foxp3+ Tregs.

