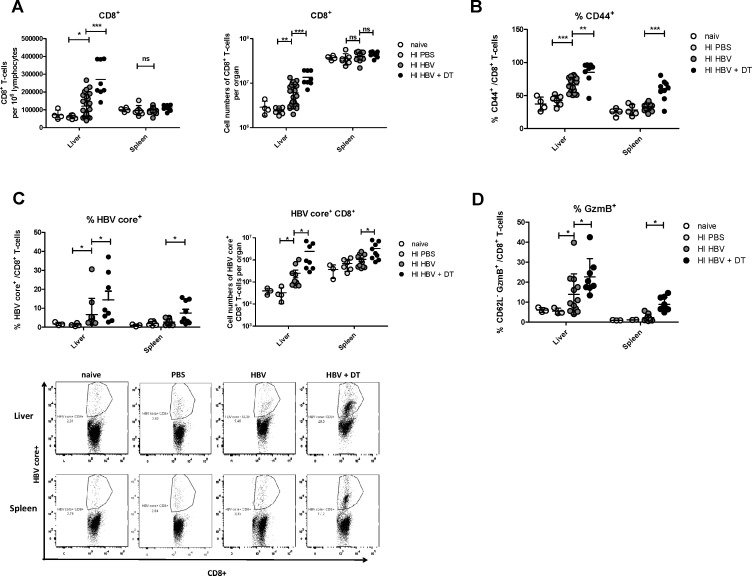
Fig 3. Impact of Treg depletion on CD8+ T cell responses in HBV-replicating mice.
DEREG mice were hydrodynamically injected with PBS or pSM2 plasmid and were treated with DT to deplete Foxp3+ Treg on day 10, 12 and 14 after HI. Mice were sacrificed on 21dpi for CD8+ T cell response analysis by flow cytometry. (A) Absolute numbers of CD8+ T cells per 1 million lymphocytes and per organ were counted in the liver and spleen. (B) Activation markers CD44 expression in intrahepatic and splenic CD8+ T cells was measured. The frequencies of virus-specific class I dimer+ (C) and CD62L- granzyme B+ (D) CD8+ T cells in the liver and spleen were measured. Each dot represents an individual mouse. Data were pooled from 3–6 independent experiments with similar results. Statistical analysis and data presentation was performed using GraphPad Prism software. All data sets were first tested for normality using the D’Agostino and Pearson omnibus normality test. Data was then assessed using either parametric one-way analysis of variance (ANOVA). The statistical significances were calculated using the Tukey’s Multiple Comparison assessment methods. When only two groups were analyzed, data was tested using a parametric Student’s T-test. Statistically significant differences are indicated by asterisks (*p < 0.05, **p < 0.01, ***p < 0.001).

